The article on Volume and Open Interest is the opinion of Optimus Futures, LLC.
- Understanding the “trifecta” of price, volume, and open interest is critical in analyzing the future markets successfully.
- Open interest can be particularly effective as many traders tend to ignore this important indicator.
- It’s important to know the interplay between these three and the basic rules underpinning their combinations.
In futures trading, price, volume, and open interest forms a critical combo for market analysis. Price is the immediate indicator; it tells you the current market direction and momentum. Volume adds context, providing a sense of the market’s energy and activity level. But open interest, unique to futures and something that many traders tend to overlook, is a subtle yet important measure of market depth. It tells whether new money is entering the market or if traders are closing their positions.
If you want to analyze the futures markets comprehensively—and trade more successfully—you need to understand the interplay between all three components.
Let’s get started. And since traders tend to be the least familiar with open interest, we’ll treat it as the primary component; the top of the pyramid to which we’ll relate price and volume.
What is Open Interest?
Open interest tells you the total number of outstanding contracts that have been opened and not yet settled. It gives valuable insight into the money flow and market dynamics in the futures market. Each open contract implies an agreement between a buyer and a seller, with the contract remaining “open” until it’s either settled or offset by an equivalent opposite trade.
Rising Open Interest: An uptick in open interest is a signal that new money is entering the market. This influx can either affirm an ongoing trend or indicate the emergence of a new one.
For instance, if the market is trending upward and open interest increases, it suggests a strong bullish sentiment, implying that the trend may continue.
Falling Open Interest:Conversely, declining open interest suggests the opposite—that the market is in a phase of liquidation. This could be an indication that the current trend is about to end or that it may even reverse.
For example, in a rising market, if open interest starts to fall, it might be a sign that the trend is losing its momentum.
Now that you understand this, let’s revisit the other two components with which you are likely more familiar.
What is Volume?
Trading volume measures how much activity takes place in a market for a given day. When volume is on the rise, it means more trading is happening – more contracts are being bought and sold compared to the previous day. This increase in volume is a crucial indicator in market trends.
Volume and trends: Trading volume is especially important in a trending market. If the volume is high and continues to rise, it usually supports the existing trend. The trend is likely to continue because the increasing number of traded contracts suggests strong investor interest in the current price direction.
Volume and reversals: Traders pay close attention to volume changes to spot potential trend reversals. For instance, if the volume starts to decrease during an uptrend, and the market’s momentum appears to weaken, it’s often a sign that traders’ interest in continuing the trend is waning, which might lead to a trend reversal.
Last but not least, let’s go over the basics of price.
What is Price?
Price is the amount of money a buyer and seller has agreed to exchange for an asset. When analyzing price in trading charts, consider the following key elements:
Momentum: This refers to the strength of the price movement in a particular direction. Analyze whether the price candles are predominantly large and moving in one
direction, indicating strong momentum, or if there is a lot of back-and-forth
movement suggesting indecision.
Volatility: Volatility is the degree of price change in a security over a given time period. It can be a good indicator of risk, as an asset with a high volatility is more likely to experience large price swings than a security with a low volatility.
Hurdles: The hurdles we’re referring to here concern areas of critical support and resistance. Always check if the price is near these key levels, which could act as hurdles, preventing the price from moving freely. A price with space to move suggests fewer immediate obstacles.
Understanding these aspects of price, along with volume and open interest, provides a comprehensive view of market activity and investor sentiment. So let’s combine all three to better understand how to interpret them in combination.
Price and Open Interest Relationship
Price Up, Open Interest Up: This combination typically indicates a strong bullish market where more traders are entering, potentially driving prices higher.
Price Down, Open Interest Up: This scenario suggests bearishness; although more contracts are being opened, prices are falling, possibly due to increased short selling.
Price Up, Open Interest Down: Here, the market might not sustain the rising prices for long, signaling a bearish outlook.
Price Down, Open Interest Down: This can be a bullish sign, indicating the closure of bearish positions and potential market strengthening.
Volume vs. Open Interest
While volume counts the number of contracts traded in a day, open interest is about the total active contracts. A scenario where both volume and open interest are rising can indicate a strong market move, as more participants are actively trading and opening new positions.
Price, Volume, and Open Interest Cheat Sheet
We can summarize everything above in this “cheat sheet” of sorts.
| Price | Volume | Open Interest | Interpretation |
| Rising | ⬆ | ⬆ | Strong bullish trend |
| Rising | ⬇ | ⬇ | Weak bullish trend |
| Declining | ⬆ | ⬆ | Strong bearish trend |
| Declining | ⬇ | ⬇ | Weak bearish trend |
Example: Confirming a successful breakout
During periods of consolidation, it’s common to observe low, declining, and below-average volume and Open Interest. A major challenge in breakout trading lies in accurately identifying a genuine breakout and discerning when a breakout is likely to fail. While volume and Open Interest may not explain every breakout, they provide valuable insights that can enhance the precision of market analysis.
Typically, when a consolidation phase ends and the market begins to move decisively in one direction, accompanied by increasing volume and Open Interest, this often signals the beginning of a new trend. An uptick in investors entering positions and growing interest in the market indicates a general agreement about the direction of price movements.
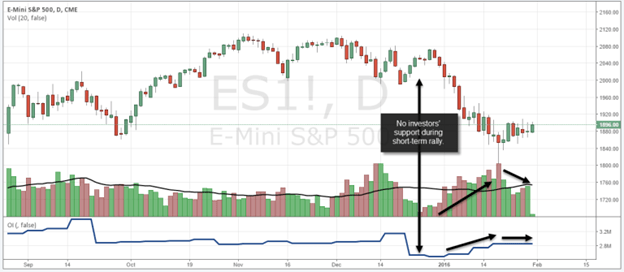
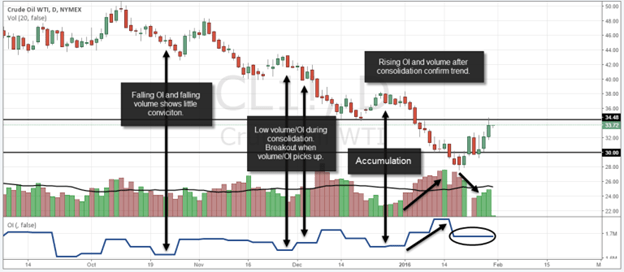
The accompanying chart illustrates the interplay of price, volume, and Open Interest analysis. Prior to the recent bearish phase, there was a brief period of rising prices, but volume and Open Interest were notably low, with both indicators experiencing significant declines.
As prices began to fall, there was a rapid increase in volume, and Open Interest quickly followed suit. Throughout the bearish trend, both volume and Open Interest continued to rise. However, as the bearish trend started to lose momentum, volume decreased, and Open Interest stabilized. This period was marked by increased price volatility and a tendency for prices to move sideways.
This scenario is a classic example of a market cycle that includes consolidation, breakout, trend development, and subsequent consolidation.
Example: Foreshadowing reversals
Analyzing Open Interest and volume can often serve as a leading indicator for pinpointing market shifts and reversals. Typically, when a strong trend phase starts to lose momentum and both volume and Open Interest begin to decrease, it suggests a reduction in trading activity.
Especially at crucial support and resistance levels, variations in Open Interest and volume can act as potential predictors, alerting traders beforehand about shifts in market sentiment.
The provided chart of WTI Crude Oil exemplifies how integrating volume, Open Interest, and price analysis can deepen the understanding of market dynamics. During consolidation phases, volume and Open Interest usually show a decline and remain below the average. The emergence of a new trend is often backed by an increase in volume and a rise in Open Interest.
Conversely, a decline in Open Interest, coupled with a change in volume, often precedes a loss of momentum following a trend.
The Bottom Line
Mastering the trifecta of price, volume, and open interest is key to analyzing the futures markets. Price serves as the immediate indicator of market direction and momentum; volume adds depth by revealing the market’s overall energy; and finally, open interest, a unique and often underappreciated aspect in futures, provides insight into market depth by showing if new money is entering or leaving the market.
These three components, when combined, offer a nuanced view of market dynamics that enable you to make more informed trading decisions.
There is a substantial risk of loss in futures trading. Past performance is not indicative of future results.