This article on Order Flow Imbalance is the opinion of Optimus Futures

Have you ever wondered what drives the sudden spikes or dips in asset prices? When you’re trading a futures contract, following its movements down to the second, what accounts for the sudden fluctuations up or down? While several factors can influence these movements, one key element is order flow imbalance.
What is Order Flow Imbalance?
Order flow imbalance arises when a substantial difference exists between the number of buy and sell orders for a specific asset. One side—buy or sell orders—greatly outweighs the other.
On a basic economic level, this is the natural flow of markets. Supply and demand always fluctuate. On a micro-level, the time scale in which most day traders operate, these imbalances can be seen in the changes in the best bid and ask prices.
Learn More | What is Order Flow Trading
How Can Day Traders Take Advantage of Order Flow Imbalances?
You can take advantage of order flow imbalances if you view them as indicators of potential price movements and strategically position your trades accordingly.
Here are a few ideas:
Anticipating Price Direction: A significant order flow imbalance, where buy orders substantially outnumber sell orders (or vice versa), often signals an impending price movement in the direction of the imbalance.
Anticipating Momentum: You can use order flow imbalances to identify market momentum.
- A strong buy-side imbalance often indicates bullish momentum, sometimes prompting traders to buy in anticipation of continued upward price movement.
- A strong sell-side imbalance could suggest bearish momentum, prompting traders to position their trades on the short side.
Taking Advantage of Illiquid Markets: If you’re a trader with a significant amount of capital, sort of like an institutional investor, you can act as a “liquidity provider” when there’s an imbalance. By taking the opposite side of the trade, you might be able to profit from the spread between the bid and ask prices while helping to correct the imbalance. Caveat: most traders don’t have this kind of capital. But if you do, this is one way to use it to your advantage.
Scalping: Not all day traders are scalpers. But if you are, you can take advantage of small, short-term imbalances in order flow. By carefully buying at the bid and selling at the ask, you can make profits from small price differences, especially in markets with high liquidity and volatility. It’s not as easy as it sounds though, so proceed with caution.
Statistical Arbitrage: You might develop or have access to sophisticated models to find statistical relationships between order flow imbalances and price movements. By identifying these patterns, you can execute trades that are statistically likely to be profitable based on historical data.
Now that you understand what order flow imbalance is and how to take advantage of it, let’s do deep into detecting order flow imbalances using the most common tools to visualize order flow: Depth of Market, or DOM.
How to See Order Flow Imbalance Using the Depth of Market
Below is a Depth of Market price ladder, more commonly referred to as a DOM.

There are three columns–one to the left, middle, and right.
Middle Column: this is where prices are represented (in this case, we’re looking at prices for the ES, or E-Mini S&P 500).
Left Column: this is the Bid side, where buyers place their limit orders.
- The numbers color-coded in green are the total amount of bids placed on each price point.
- These bids are limit orders, which essentially means that a buyer wants to purchase a certain number of contracts at this price point or better (meaning lower).
- There are 10 bid levels, each corresponding to a given price level (the limit orders beyond the 10th level can’t be seen, as most platforms have a DOM limit).
Right Column: this is the Ask side, where sellers place their limit orders.
- The numbers color-coded in red are the total amount of asks placed at each price point.
- These asks are also limit orders, representing the number of contracts a seller would like to sell at this price point or better (meaning higher).
- There are 10 ask levels.
The current price highlighted in blue is the price at which the last trade took place–someone bought contracts from another who sold it to them.
The best bid and best ask are the pairs that are closest to one another.
The spread between the bid and the ask is the difference between the “best ask,” in this case 2168.00, and the “best bid,” which is at 2167.75. As you can see, there’s a tight 0.75 spread which amounts to 1 tick.
Now that you understand the basic components of a DOM, let’s explore how the bids and asks work to create the transactional dynamics known as “order flow,”
Let’s take a closer look at the DOM again.

You see a static image, but if you were to witness a DOM during busy trading hours, you would be amazed at how quickly bids and asks can fluctuate.
This image is a snapshot of a moment in time during a trading day. It might stay this way for a few seconds when markets are slower, or it might vanish in milliseconds when markets are bustling.
The main point is that DOM movements are quite dynamic most of the time. Bids and asks are flying at a rate that can be difficult for your eyes and brain to comprehend.
So, what just happened with the current price? It got filled at the ask. But who filled it?
Here’s a crucial piece of information you need to understand:
All orders in the bid and ask levels are limit orders. The buyers are saying “I want my bid to be filled at this price or lower (which would be a better price). The sellers are saying the same thing, but their “better” price is higher. After all, it’s about “buying low and selling high,” right?
So, now we have a standoff. For the moment, neither the buyers nor sellers are budging. Their bids and asks will not be filled by the other.
So who filled the ask? Who created the order flow imbalance, or the imbalance in supply and demand, that caused prices to move upward? Answer: a buyer with a “market order.”
A market order practically means “fill my position NOW…at the best (bid or ask) price.” In the case above, a buyer placed a market order and got filled at the best asking price, which is at 2168.00.
Do you get the picture now? Another way to look at it is that limit orders are there for market orders to fill. Another variation is that limit orders will not get filled until a corresponding market order matches it.
Okay, but how does this move the price? Now, we’ll describe the “order book” dynamics, after which you’ll clearly understand how prices are moved.
Understanding the DOM as an Order Book
Let’s take the DOM data and transfer it to a spreadsheet so that we can simulate a few different scenarios.
Here’s what the current situation looks like.

Scenario 1: A large trader enters a market order to buy 1,000 contracts. This order will go to the best asking price, and in doing so, it creates a significant order flow imbalance: 1000 orders to buy against only 290 orders to sell.
Here’s what happens as a result.

(The example above is hypothetical).
How did we get from 2168.00 to 2168.25? The order flow imbalance caused the price to move upward. Here’s what happened:
- The 290 sell limit orders were all filled, bringing that number to 0.
- Of the 1,000 market buy orders, 710 orders have yet to be filled (1000 market buys – 290 sell limits = 710 market buy order balance).
- On the second ladder–of 843 sell limit orders–the remaining 710 market buy orders will be matched with those sell limits, leaving a balance of 133.
- 25 is the new current price, the buys having moved the price up one tick.
- Let’s imagine that 203 new limit orders were placed at the bid side for 2168.00 after price had ticked up (new buyers jumped in).
In the above example, the sell orders were absorbed by the larger number of market buy orders. A similar process will begin again.
Scenario 2: A negative economic report has just been released. Hundreds of traders are looking to exit or sell short the S&P 500. All of them enter market sell orders at once–meaning sell at the best bid price.
The total number of market sell orders amounts to a whopping 7,000 contracts!

Let’s imagine that 2168.00 bids were 203; exactly where we left off in the example above.
7,000 sell orders versus 203 buy orders is a massive imbalance. So you can see in the example how the 7,000 market sell orders just wiped out, so to speak, eight price ladders of bids, filling each ladder at rapid speed as the price of the S&P 500 plunged to 2166.25.
That’s how the DOM (order book) and market orders work to create order flow and price movements.
How Might You Analyze Order Flow Imbalance?
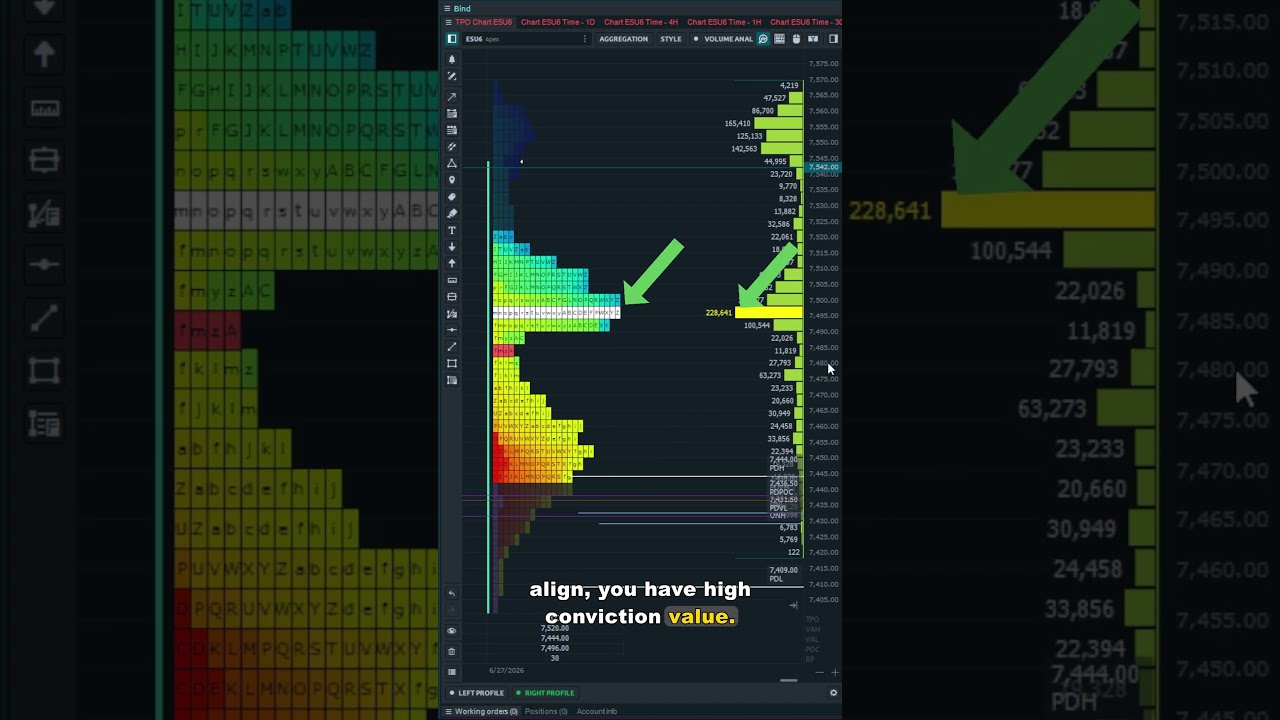
Analyzing order flow imbalance can be a tricky matter as you are always reading past information. In terms of order book data, you can only see the limit orders–in other words, you cannot see the market orders that jump in until the moment that they do.
This is where Footprint software comes in handy. It can help you interpret the imbalance of orders and trades to help you better speculate whether a price move indicates short-term bullishness or bearishness.
This is a lot to digest, so let’s break it down. Imagine this scenario.
In a footprints chart…
- Bids that were filled (sold) are on the left.
- Asks that were filled (bought) are on the right.
- You match the bids and asks diagonally.
So if we see the following…

We match 29 (bids that were filled by sellers) to 31 (asks that were filled by buyers).
So sellers filled 29 bids, and buyers filled 31 asks. That’s pretty balanced, correct? 29 to 31 gives us a bid-to-ask ratio of 93% and an ask-to-bid ratio of 106%.
Overall, that’s near a 100% match. There’s no order flow imbalance there.
But imbalances are what move prices. So, if you can identify the imbalance, then you might have the edge over another trader who can’t see it.
Look at the following. You can see there is an order flow imbalance toward the downside as the selling pressure (194 contracts) was 625.81% greater than the buying (31 contracts). The left side will show an imbalance by highlighting the numbers in red. This indicates potential bearishness.

In a reverse scenario, the buying pressure below is 444.83% greater than the selling pressure. Hence, it is highlighted green to indicate an imbalance. This indicates potential bullishness.

Question: what constitutes a significant imbalance? It’s really up to you as to what you might deem significant. It also depends on the historical tendency of a given market, and how it responds to a certain % level of imbalance.
You can set your % imbalances accordingly. For example:
The footprints chart below has a setting of 300%, meaning that only buying or selling pressure of 300% or above will be highlighted. In the next example, you can see tremendous selling pressure which plunged the price of a given commodity.

Looking at the percentages, you can see how the selling pressure plunged prices downward.
What might this mean for the next bar? This is where a footprint-like chart can give you a closer insight into order flow. To view an actual Footprints chart, take a look below:

Caveat: you don’t know which market orders are about to jump in BUT the current indications of buying or selling pressure might help inform your directional bias.
And when it comes to using order flow to your advantage, such information is probably the closest thing you’ll get to understanding the forces shaping the current market.
Trade Order Flow Imbalances with our FREE trading platform – Optimus Flow
Want to learn order flow? Ask questions here on our community site.There is a substantial risk of loss in futures trading. Past performance is not indicative of future results. When considering technical analysis, please remember educational charts are presented with the benefit of hindsight. Market conditions are always evolving, and technical trading theories and approaches may not always work as intended. is a substantial risk of loss in futures trading. Past performance is not indicative of future results.