This article on Order Flow Software is the opinion of Optimus Futures.
There are so many options when it comes to what software to use as a trader, especially when you have a specific strategy in mind like order flow.
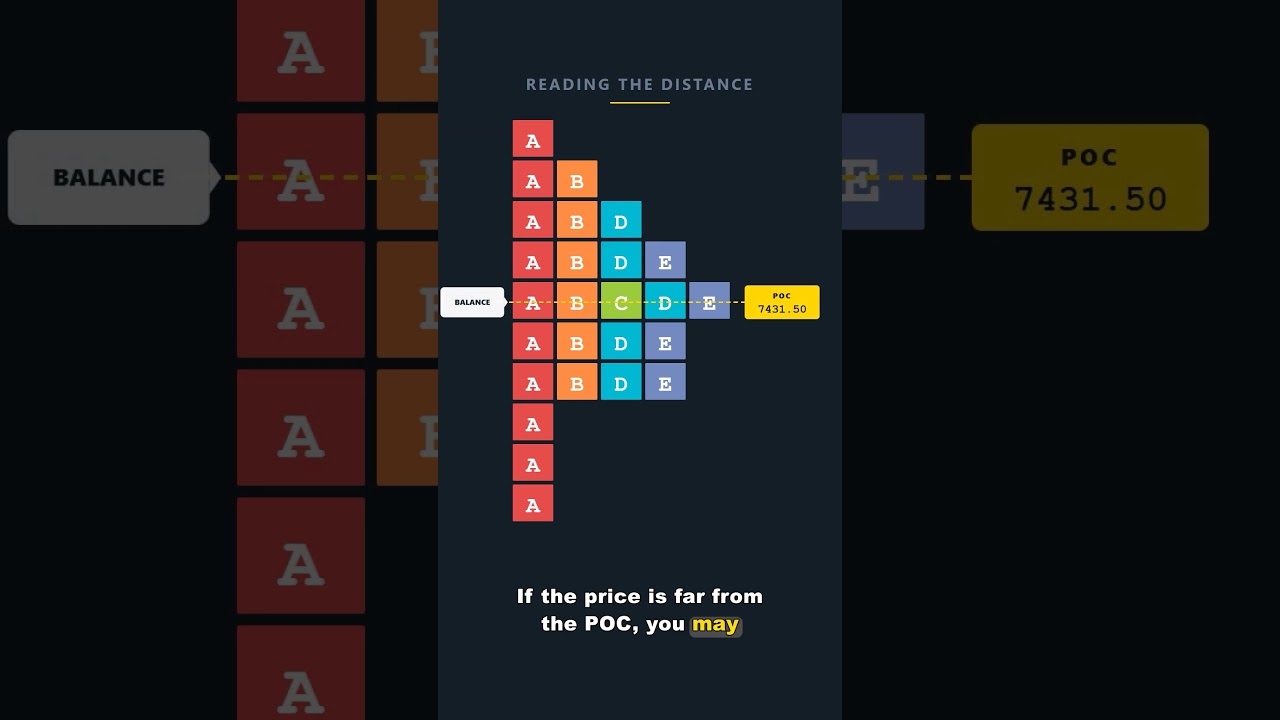
Order flow trading has become extremely popular recently as it goes deeper into the candle, showing how buyers and sellers interact with each other at every price level.
The article identifies five crucial tools for order flow analysis:
- Footprint Chart: Offers a detailed view of market activity within each price level.
- Volume Profile: Displays volume distribution across price levels.
- Depth of Market (DOM): Shows real-time order book data.
- Market Delta: Measures the difference between buying and selling pressure.
- Power Trades: Identifies large orders executed in short time frames.
Learn how each tool functions along with step-by-step instructions on how to access and use these tools within the Optimus Flow trading platform.
Understanding Order Flow
Before delving into the nuances of order flow software, it’s essential to grasp the concept of order flow itself. Fundamentally, order flow denotes the influx of buy and sell orders into the market.
These orders originate from diverse market participants, ranging from individual traders to institutional investors, hedge funds, and algorithmic trading systems. Each order contributes to the overall market dynamics and influences price fluctuations.
Historically, traders relied on technical analysis, fundamental analysis, and market sentiment to inform their trading decisions.
While these approaches offer valuable insights into market trends and behavior, they often lack the precision and up-to-the-minute data necessary to navigate the intricacies of contemporary financial markets.
How Order Flow Plays a Role in Your Strategy
Order flow plays a vital role as it reveals the precise dynamics of buyer and seller interactions, particularly at significant price levels when combined with technical analysis. For instance, imagine you’re monitoring a support level and contemplating a buy trade.
The optimal scenario involves the support level holding firm with buyers absorbing any market selling.
Subsequently, you’d want to witness a decline in selling pressure, accompanied by an increase in buyer activity, ultimately leading to market buying as new buyers enter and existing sellers close their short positions.
It’s crucial to observe whether other market participants are engaging at that level, the volume of market selling, and whether such selling is diminishing.
Blindly executing a buy order at a key level isn’t advisable; confirmation is essential to validate your trading thesis and enhance the likelihood of success.
Although candle charts offer insights into price movement and volume, they lack the precision to capture these intricate interactions fully.
Moreover, a conventional bar or candlestick chart can only provide limited confirmation signals. In line with our trading thesis, it’s optimal to see a confluence of factors align before executing a trade, beyond mere price action and volume.
Therefore, gaining a comprehensive understanding of order flow is essential for making well-informed trading decisions and improving the probability of success.
Defining Elements of Confirmation and Translating into Order Flow Software Tools
In the preceding thesis, we identified several key components within price action and order flow that are essential for validating and initiating trades.
Now, let’s define these elements and explore the tools available on our trading platform to transform them into measurable metrics:
- Price dynamics
- Volume fluctuations
- Limit bids and offers
- Market buying and selling activities, encompassing frequency and magnitude
Price Dynamics or Price Action
Charting plays a fundamental role in analyzing price movements and making informed decisions. Traditionally, traders have relied on candlestick charts or standard bar charts to visualize market behavior. While these charts provide valuable insights, they may not fully capture the intricacies of order flow dynamics.
Enter the Footprint chart, an alternative chart type that offers a more comprehensive perspective. Unlike traditional charts, the Footprint chart allows traders to delve deeper into order flow dynamics, offering insights into limit bids and offers, as well as market buying and selling activity.
This granular level of detail empowers traders to make more informed decisions based on a deeper understanding of market sentiment and liquidity dynamics.
Recognizing the value of integrating different chart types, traders can enhance their analysis by combining the insights gleaned from both candlestick and Footprint charts.
By doing so, they can utilize the strengths of each chart type to gain a more holistic view of market conditions and refine their trading strategies accordingly.
Order Flow Software Tool: Footprint Chart

Volume Fluctuations
In any trading thesis and trade concept, grasping volume dynamics is essential for making informed decisions. Traditionally, traders often assess volume within a time-based framework, where they track the volume of trades occurring over set intervals.
However, this approach has its limitations, as it doesn’t account for the nuances of volume activity at different price levels.
By adopting a more nuanced perspective that incorporates both time and price, traders can gain deeper insights into market dynamics.
This involves analyzing volume not only in relation to time but also in relation to specific price levels. Such an approach unveils key areas of interest for market participants and provides valuable clues about potential price movements.
Order Flow Software Tool: Volume Profile

Limit Bids and Offers
The market comprises two primary types of orders: Market orders and limit orders. To comprehend their impact on prices, consider this analogy:
Limit orders shape the market, while market orders drive its movement. Nonetheless, the actions of limit orders can alter the best available bid and offer, even in the absence of executed market orders.
We often witness this scenario unfold preceding the release of an economic data point. During this period, the influx of market orders diminishes, while limit orders fluctuate rapidly due to adjustments made by algorithmic trading programs.
Market orders also dictate the last recorded price displayed on the chart. To illustrate, consider an extreme case where only one market order is executed at 5200.00, making it the last printed price on the chart.
Suppose the subsequent market order is executed 30 seconds later at 5200.25; the chart would update to reflect this as the last price. However, during the 30-second interval between market orders, the limit orders could have shifted downwards to 5199.00 or upwards to 5201.00, or even beyond.
In this example, if we solely relied on a bar chart, it would suggest that the price moved from 5200.00 to 5200.25, just one tick in the Mini S&P. However, in reality, the market activity extended well beyond this apparent range, with bids and offers fluctuating over a broader spectrum.
This holds significance because when we conduct trades, we aim to gather comprehensive information concerning price movements and order flow to validate our trading hypothesis. Relying solely on a candlestick chart fails to offer sufficient insights into market and limit orders, particularly regarding order flow dynamics.
Order Flow Software Tool: Depth of Market

Market Buying and Selling Activities, Encompassing Frequency and Magnitude
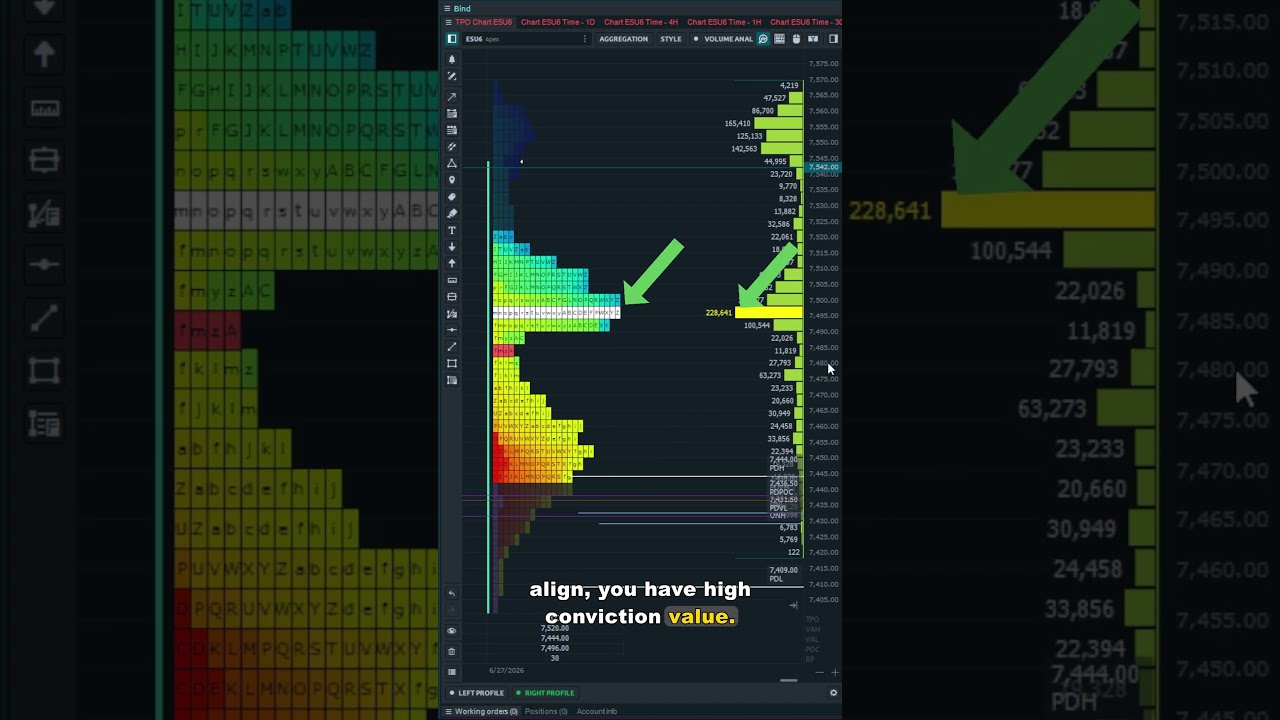
Building upon the concept of Limit Bids and Offers, let’s delve into Market Buying and Selling, which is also quantified through Delta.
The discrepancy between buyers and sellers serves as the main driver for price fluctuations. Moreover, Delta provides valuable insights into the overarching market sentiment.
Delta is determined by the difference between the total volume of market buying and market selling at a specific price level.
For instance, consider a scenario where the market is trading at 5000.00 and 5000.25. If a trader executes a market buy order for 100 contracts, followed by another trader executing a market sell order for 50 contracts, the cumulative delta would amount to 50 (100 – 50).
This holds significance as it involves a trader conveying their outlook on future prices through their trading activities. When there’s a higher influx of market buy orders compared to sell orders, it becomes pivotal information for formulating a trading hypothesis.
Additionally, understanding the frequency and magnitude of these orders provides valuable insights into the collective market sentiment among traders.
To observe this, we can add the delta to any chart along with Power Trades to identify large orders coming into the market.
Order Flow Software Tool: Market Delta and Power Trades

We have identified five tools that are imperative to have in order flow trading software:
- Footprint Chart
- Volume Profile
- Depth of Market
- Market Delta
- Power Trades
Incorporating Order Flow Into Your Charting Software
For those who already have access to real-time data and utilize Optimus Flow for charting, integrating these advanced tools is both quick and straightforward.
A key advantage of Optimus Flow is its comprehensive suite of built-in features specifically designed for order flow trading. This all-in-one solution eliminates the need for additional plugins or costly subscriptions, streamlining your trading setup and enhancing your efficiency.
Footprint Chart
You can create a Footprint chart from any bar chart with Optimus Flow. Simply open the chart, then click on the magnifying glass to show the Volume Analysis Toolbar. There will be a bar of options that shows up at the bottom of the chart:

Click on ‘Cluster’ to open the options to access the Footprint chart:

Copy these selections to access the Footprint chart which shows market sell trades on the left and market buy trades on the right. Be sure to click ‘Enabled’ to add it to the chart. To change the color of these settings, click on the gear icon where you will find options on how this information is displayed.

Volume Profile
To access the Volume Profile, you have the option to place it on either the left or right side of the chart. For this example, let’s click on ‘Left Profile’ to position the Volume Profile on the left side of the chart, displaying yesterday’s volume.

Depending on your trading style or holding period, you have the flexibility to adjust the time frame for displaying volume in Optimus.
The platform offers options ranging from 15 minutes to monthly intervals. You can customize the color scheme by clicking on the colored square and access further settings via the gear icon for additional customization.
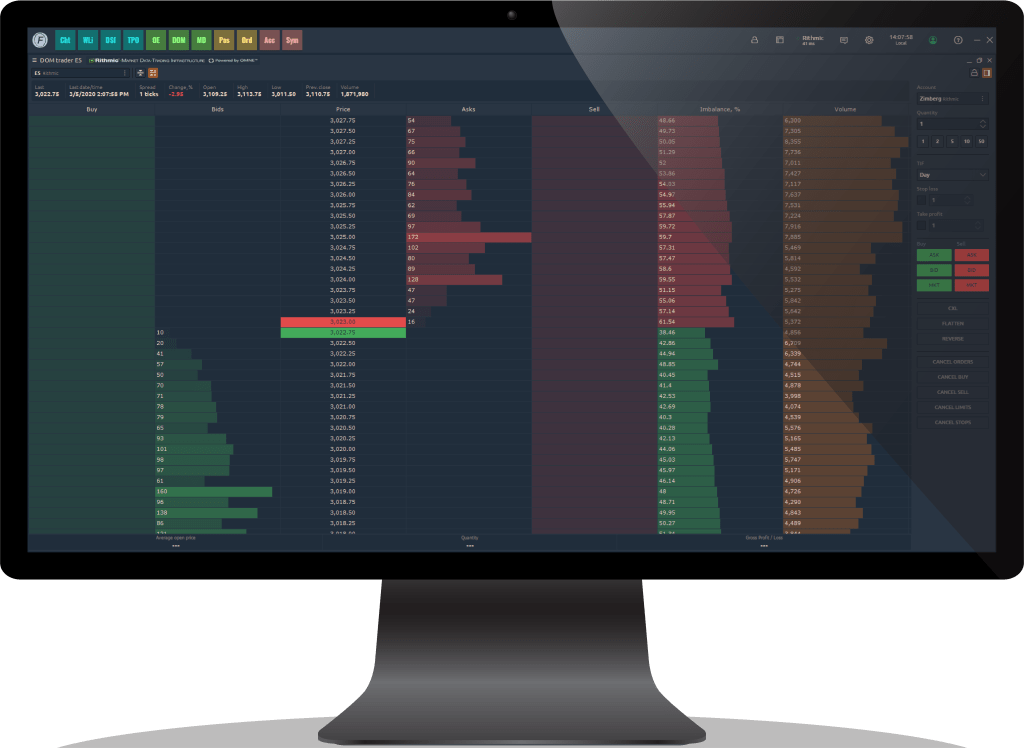
Depth of Market
The Depth of Market (DOM) will open in a separate window from your charts. To access it, navigate to the top menu and click on ‘DOM.’
This action will open a new window displaying the Depth of Market. You can then position this window anywhere within your workspace according to your preference.

Within the Depth of Market (DOM) window, you can display a wide array of information by right-clicking anywhere and activating specific columns. However, a good starting point is to show the following:
- Buys
- Bids
- Price
- Asks
- Last Traded Size
- Sells

This will provide you with enough information about how orders are coming into the market without getting clunky and visually overwhelming.
WATCH | A Powerful Order flow Tool for Finding Setups and Trade Management
Market Delta
Market Delta can be incorporated into your charts in several ways. The first method is to add it to a standard bar chart.
Simply right-click anywhere on the chart, select ‘Indicators,’ then ‘Add Indicator,’ and search for and select ‘Cumulative Delta.’


This will bring up a bar chart on the bottom of the chart showing cumulative delta:

Another way to view Market Delta is by adding it to the Footprint chart through the ‘Time Statistics’ option. With this method, delta will be displayed as a number.
This approach allows you to see the delta for each individual bar as well as the cumulative delta, providing a comprehensive view of market activity.

Power Trades
The Power Trades indicator highlights the execution of a large number of orders within a short time frame, which can significantly impact price movements.
To display this indicator, navigate to the bottom right of the Volume Analysis Toolbar, select ‘Power Trades,’ and then fill in the required parameters.

For this example, set the volume to 500 and the time frame to 1.0 seconds. This configuration will highlight areas where over 500 contracts have been traded in less than one second.
Those are the five most impactful pieces of software for order flow trading. These tools can profoundly enhance your trading strategy by offering a more in-depth analysis of market activity.
By examining the intricate details within the candlesticks, they allow you to observe the dynamic interactions between buyers and sellers. This granular insight is essential, as it is the interplay between buying and selling pressures that fundamentally drives price movements.
Whether you’re a novice or an experienced trader, incorporating these tools into your trading arsenal can provide a significant edge in understanding market behaviors and making more informed trading decisions.
Try Optimus Flow
Order Flow Trading Platform
There is a substantial risk of loss in futures trading. Past performance is not indicative of future results. When considering technical analysis, please remember educational charts are presented with the benefit of hindsight. Market conditions are always evolving, and technical trading theories and approaches may not always work as intended.