This article on Trend and Wave Analysis is the opinion of Optimus Futures, LLC.
- Understanding Trend and Wave analysis is like seeing the market in high-def (it can seriously level up your trading game).
- Theory is one thing, practice is another, and so we’ve rolled up our sleeves to demonstrate a few price action examples.
- If you can spot changes in swing highs and lows, it’s like seeing a plot twist before it happens – you can catch trend reversals or continuations early.
Previously, we’ve delved into various indicators and tools for charting that aid us in comprehending price movements.
Today, we’re shifting gears to concentrate on the most fundamental method of price and chart scrutiny: Trend and Wave analysis.
We’ll delve into how identifying swing highs and swing lows, along with trend wave analysis, can offer traders a broader perspective of the market scenario.
Every robust chart analysis should kick-off with an investigation of trend and wave analysis. We’ll guide you through how to tackle it, referencing the latest price fluctuations in Gold Futures and 30-Year T-Bonds Futures.
The Basics of Trend Analysis
Before we go any further, let’s break down the concept of “trend” (uptrend and downtrend) to its most basic parts.
What Makes An Uptrend and Downtrend?
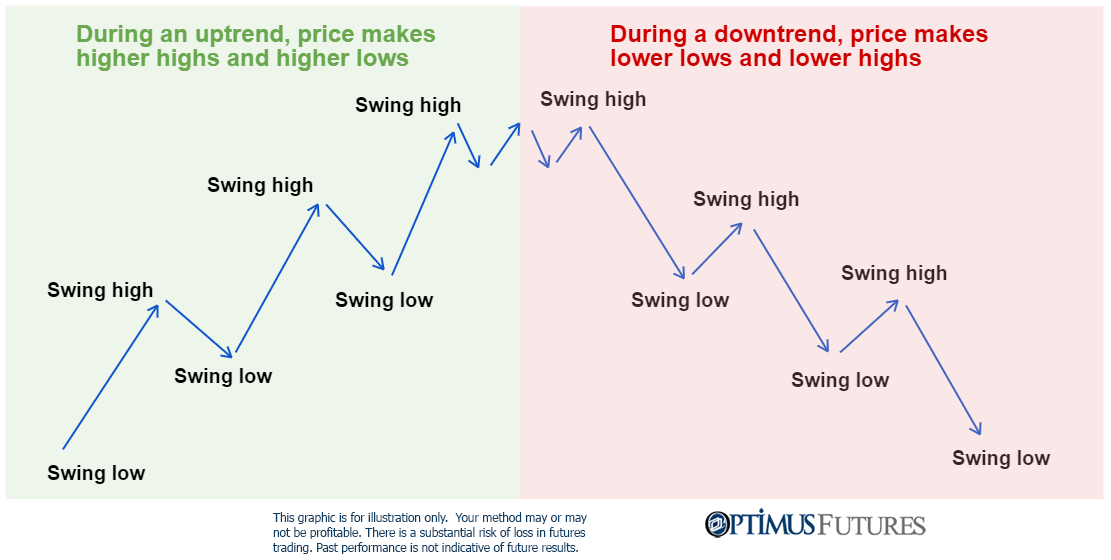
An uptrend in financial markets is characterized by a consistent increase in asset prices over a period of time, marked by a series of higher highs and higher lows.
This pattern reflects increasing demand and optimism among market participants, driving prices higher.
A higher high refers to a peak in price that is greater than the previous high, while a higher low is a trough that is higher than the preceding low.
The presence of higher highs and higher lows in a price chart indicates that buyers are dominating the market and are willing to pay higher prices for the asset.
However, if the price fails to make a new higher high or if it breaks below the last higher low, the uptrend may be in question.
This signals a potential shift in the balance of power between buyers and sellers, with selling pressure possibly mounting. At this point, traders should closely monitor price action for further confirmation of a trend reversal or continuation.
On the other hand, a downtrend is a sustained decline in asset prices over time, marked by a sequence of lower lows and lower highs.
This pattern signifies decreasing demand and growing pessimism among market participants, causing prices to fall.
A lower low is a trough that is lower than the previous low, while a lower high is a peak that is lower than the preceding high.
The presence of lower lows and lower highs in a price chart indicates that sellers are dominating the market and are able to push prices lower.
Just as with uptrends, if the price fails to make a new lower low or if it breaks above the last lower high, the downtrend might be in question.
This suggests a potential shift in market sentiment, with buying pressure possibly increasing. Traders should closely watch price movements for further evidence of a trend reversal or continuation.
In summary, higher highs and higher lows are the defining characteristics of an uptrend, while lower highs and lower lows signify a downtrend.
These patterns help traders identify the prevailing market direction and inform their trading decisions accordingly. Recognizing when these patterns break or fail to form can provide valuable insights into potential trend reversals or continuations.
Now that you understand how highs and lows in particular sequences constitute the basic components of an uptrend and downtrend, now let’s introduce the concept of swing lows and swing highs.
What are swing highs and swing lows?
A swing high and a swing low are technical analysis terms that refer to the peaks and troughs made by the price of an asset, respectively.
A swing high is a price peak, or the highest point reached before the price starts to fall.
It represents a point where the asset’s price reached a high that was greater than the prices immediately before and after it.
In other words, it’s when the price goes up, then down. Swing highs are typically used to identify potential resistance levels or the start of a new downtrend.
A swing low, on the other hand, is a price trough, or the lowest point reached before the price starts to rise.
It represents a point where the asset’s price reached a low that was lower than the prices immediately before and after it.
Essentially, it’s when the price goes down, then up.
Swing lows are typically used to identify potential support levels or the start of a new uptrend.
A swing high marks the temporary pause of an upward price movement before it reverses direction, while a swing low signifies the temporary halt of a downward trend before it begins to ascend.
In an uptrend, the price typically forms a pattern of increasing highs and lows, while a downtrend is characterized by decreasing highs and lows – this fundamental concept, while seemingly simple, is a practical tool for understanding real-time market behaviors.
Pivotal moments are identified by the shifts when the price doesn’t reach a new high in an uptrend or a new low in a downtrend.
Analyzing Gold Price Action
Let’s take a look at the price action in Gold. We are starting on the daily timeframe, but these principles are universal and can apply to any timeframe and market.
When we start on the left, we see that price was in a short-term downtrend, and then suddenly failed to make lower lows. The transition is apparent, and price slowly turned and started making higher lows.
And once price started making higher highs, it foreshadowed the upside reversal.
Price then paused and consolidated. However, the selling pressure wasn’t enough to make the price go to lower lows. At the same time, it kept making higher highs – those signals indicated that the trend wasn’t over yet.
At the top, it looked very different. Price failed to make higher highs and then even started making lower highs. The lows formed a support level, and on the break of that level, the price started the sell-off.
Right now, the price is still making lower lows, confirming the downtrend. However, the momentum seems to be slowing down.
Nevertheless, as long as the price keeps making lower lows, the downtrend is confirmed by general market theory.

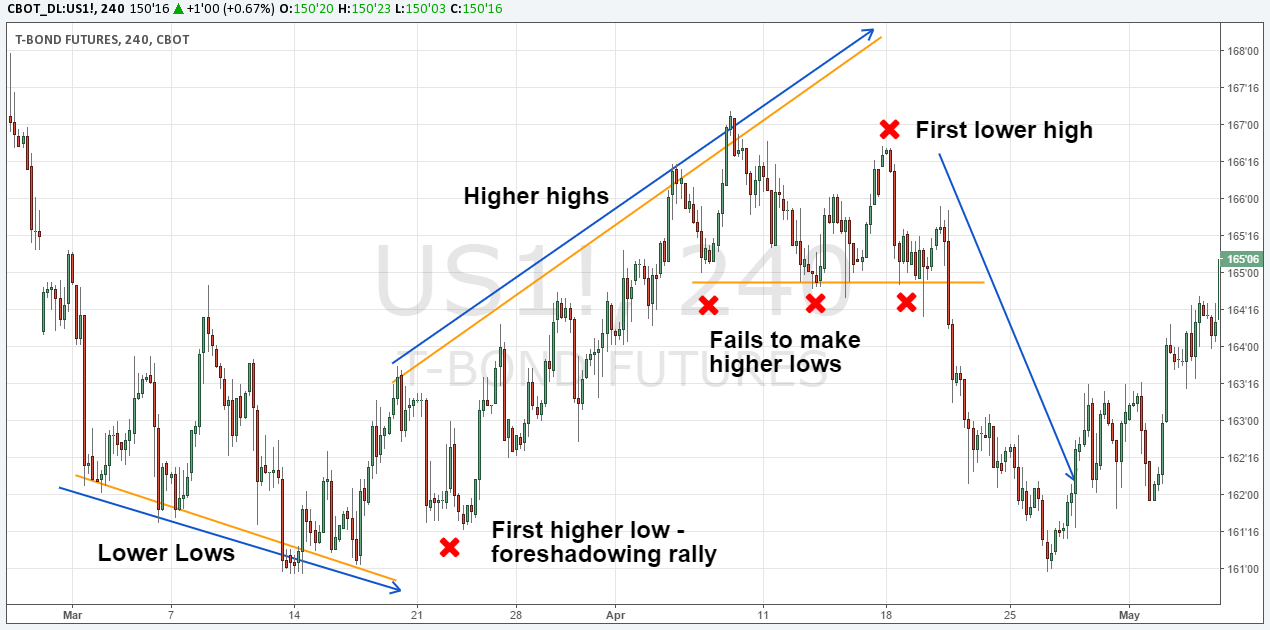
Treasury Bond Market Phases
The snapshot of T-bonds shows how those principles of the swing high and swing low analysis can be applied to different asset classes as well.
We start on the left and see that price was making lower lows. However, the lows barely broke the previous lows which signaled a weak downtrend. Suddenly, the price made its first higher low, foreshadowing the uptrend. During the uptrend, the price kept making higher highs and higher lows.
At the top, we see the familiar pattern again, and price first made a lower high and then broke the support level.
You can already see how the recent downtrend then slowly turned when price failed to make lower lows and the cycle repeated itself.
You can see how a deeper look into swing and wave analysis can help traders get a clearer understanding of price action and trend behavior.
We recommend that traders start their chart analysis by looking at simple price charts first, before getting into the nitty gritty on the lower timeframes.
Such an approach is ideal for the so-called top-down analysis where traders start on the higher timeframes and then work their way lower.
As an additional tip, we suggest you use the line graph for such an analysis. Particularly in the beginning, when getting rid of the information overload of candlestick charts can help traders better understand price action.

The Bottom Line
We’ve examined how identifying swing highs and lows can provide a comprehensive view of market trends and turning points.
Through a deeper understanding of uptrends, downtrends, and the role of swing highs and lows, we can better navigate the complexities of price fluctuations.
With enough experience, you might even begin anticipating price reversals and continuations long before they take place.
Remember, this is applicable across different timeframes and markets, making it a super versatile tool for any trader’s arsenal. Good luck!
For more on How to Analyze Price Action, read our Ultimate Guide to Price Action.
There is a substantial risk of loss in futures trading. Past performance is not indicative of future results.