This article on trend trading is the opinion of Optimus Futures.
Being able to read charts, and trend structure in particular, is an important trading skill that can help traders better understand market moves and enable them to apply their trading method in the right situation.
No system works all the time and knowing how to differentiate between trends and consolidations is an important aspect of trading. In this article, we introduce 5 different ways traders can make sense of charts and which indicators to use to understand price structure correctly.
Classic Dow Theory – Highs and lows
Many traders feel lost when looking at pure (naked) price charts but the analysis of highs and lows, in the sense of the Dow Theory, can already tell you a lot about the market you are looking at.
It all starts with the classic definition that a bullish trend exists when you see ‘higher highs and higher lows’. A range is, thus, defined by price movements where highs and lows don’t follow this rhythm. The screenshot below shows that nicely; during trends, highs and lows move either up or down and the pattern is usually clearly defined. When the pattern is broken and price stops making higher highs during an uptrend, it can foreshadow a potential turnaround. During a range market, price moves sideways and highs and lows don’t break out anymore.
Moving Averages
Following the moving average cross-over strategy can be a good first indication of the market structure. Preferably, you want to use a slow and a faster moving average; in our example we used a 9 and a 26 period moving average. When the fast moving average is above the slower one, it usually signals an uptrend and when the fast moving average is below the slow moving average, it can signal a bearish trend.
The further apart the two moving averages are, the stronger the current trend. A cross-over of the two moving averages, after a trending phase, can signal a shift into the opposite direction. When the two moving averages are close together and keep crossing each other, it usually signals a range market. Those signals are usually very obvious and it can pay off to note changes in the way the moving averages shape.
ADX
The ADX (Average Directional Movement Index) is the classic trend indicator and it consists of two lines: a red and a green line. Reading the ADX is straight forward: when the green line is above the red one, it signals an uptrend and when the red line is above the green line, is signals a downtrend. The further apart the two lines, the stronger the trend. And when the two lines are close together, you are usually dealing with a range market.
The ADX is often combined with other indicators such as moving averages; in such cases, the ADX is used to estimate trend strength and the moving averages are used to ride trends and find turning points with the cross-over. However, there are many more usage possibilities with the ADX.
MACD
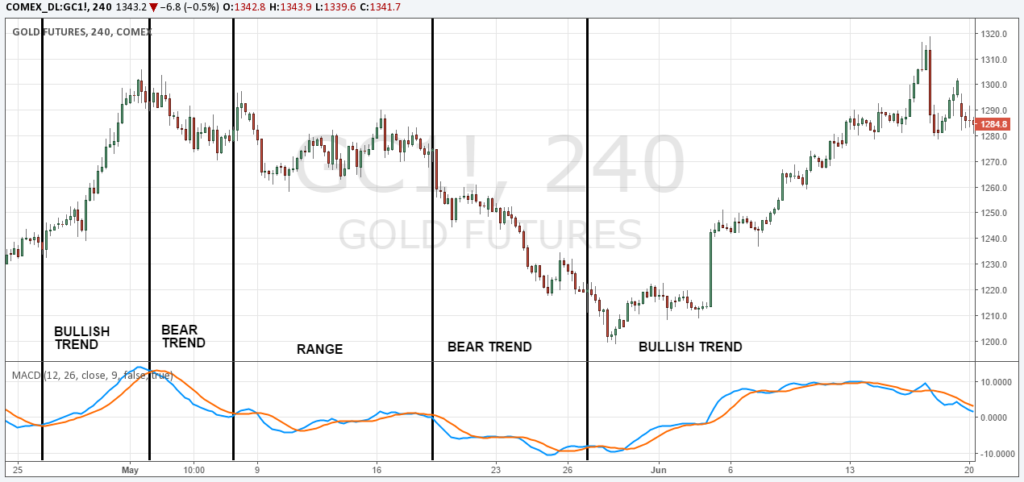
The MACD is one of the most popular indicators and it’s based on moving averages, hence the name MACD – moving average convergence divergence.
The MACD works similar to the moving average cross-over system we discussed above. When the two lines in the MACD are moving up or down and are far apart from each other, price is in a trending market. When the two lines cross, it signals the loss of momentum and the possible end of a trend. In a range market, the two MACD lines are very close together and move sideways.
Bollinger Bands
Bollinger Bands consists of a moving average in the center and two volatility bands to each side. By default, the Bollinger Bands are set to two standard deviations. During a trend, price usually stays on one side of the moving average (above the moving average during an uptrend and vice versa) and trends close to the outer Bollinger Bands. When price fails to reach the outer Bollinger Bands during a trend, it can foreshadow a potential end of a trend because momentum is fading. The cross to the other side of the center line is then usually the final signal of a trend change. During range markets, price moves back and forth between the outer Bollinger Bands. Fake breakouts that get rejected at the outer Bollinger Bands are often used by range traders and they can signal that the range support and resistance is holding. Bollinger Bands are a multi-faceted trading indicator that can be used during all types of market conditions.
Which is the best trend trading indicator?
Of course, the question for the best indicator always comes up in this context and the answer nobody wants to hear is that no indicator is better than the other and that it really does not matter as well. All indicators have their pros and cons and essentially they can all be used to analyze price, trend strength and momentum. Often, it comes down to personal preferences of the trader which indicator he feels most comfortable with.
At the same time, we want to warn you that frequently changing indicators should usually be avoided. Instead, you should choose your indicator(s) that you want to use in your own trading and then become an expert at it.
There is a substantial risk of loss in futures trading. Past performance is not indicative of future results.


