The article on TradingView TPO Charts is the opinion of Optimus Futures, LLC.
In the constant search for an edge in the futures market, harnessing the power of Time Price Opportunity (TPO) charts can significantly enhance market analysis, particularly for those trading futures with platforms like TradingView and Optimus Futures.
TPO charts offer a unique way to view price action over time, providing insights that traditional candlestick charts may not reveal.
Here’s how to leverage TPO charts to refine your trading strategy and maximize market opportunities.
Understanding and Leveraging TPO Charts
Time Price Opportunity (TPO) charts are dynamic visualization tools that provide deep insights into market behavior during each trading session.
Unlike traditional candlestick charts, TPO charts break down price action into specific time intervals, each marked by a letter or color.
This unique representation allows traders to see where and how long trading volume is concentrated at various price levels throughout the day.
Key Features and Benefits of TPO Charts:
Comprehensive Market Analysis: TPO charts are handy for identifying the Point of Control—the price level with the most trading activity during the session. This point often serves as a pivotal support or resistance level in future sessions, guiding traders in making informed decisions.
Market Sentiment and Structure: By observing the concentration of activity, traders can assess market sentiment; a higher concentration at higher price levels indicates bullish sentiment, and vice versa.
Additionally, TPO charts clarify market structure by showing the duration that price stays at specific levels, which is invaluable for spotting phases of accumulation, distribution, and potential breakout points.
Volume-at-Time Insight: Unlike volume histograms that show total volume at a price level, TPO charts provide a time-based view of trading volume. This perspective helps traders understand which times of the day are most active or passive, allowing for strategic planning around periods of high or low activity.
How to Setup of TPO Charts on TradingView
Access Indicators Menu: Start by navigating to the “Indicators & Strategies” button located at the top of your TradingView chart. This is your gateway to accessing a comprehensive library of tools and indicators.
Finding TPO: In the search bar within the Indicators Menu, type “Time Price Opportunity” or “TPO.” This will quickly filter out unrelated tools, bringing up the TPO chart option.
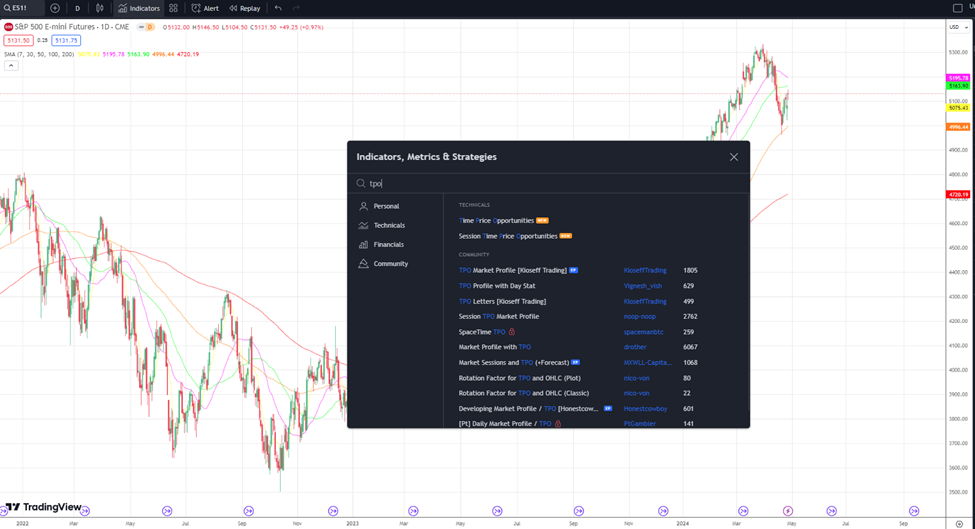
Adding TPO to Your Chart: Select the TPO option from the list to add it directly to your chart. Once added, you’ll notice an immediate change in how your data is visualized, shifting from standard chart types to a TPO format which displays data blocks representing trading activity over time.
Customizing TradingView TPO Chart Settings
After adding the TPO chart to your workspace, customization is key to ensuring the data aligns with your trading style and preferences:
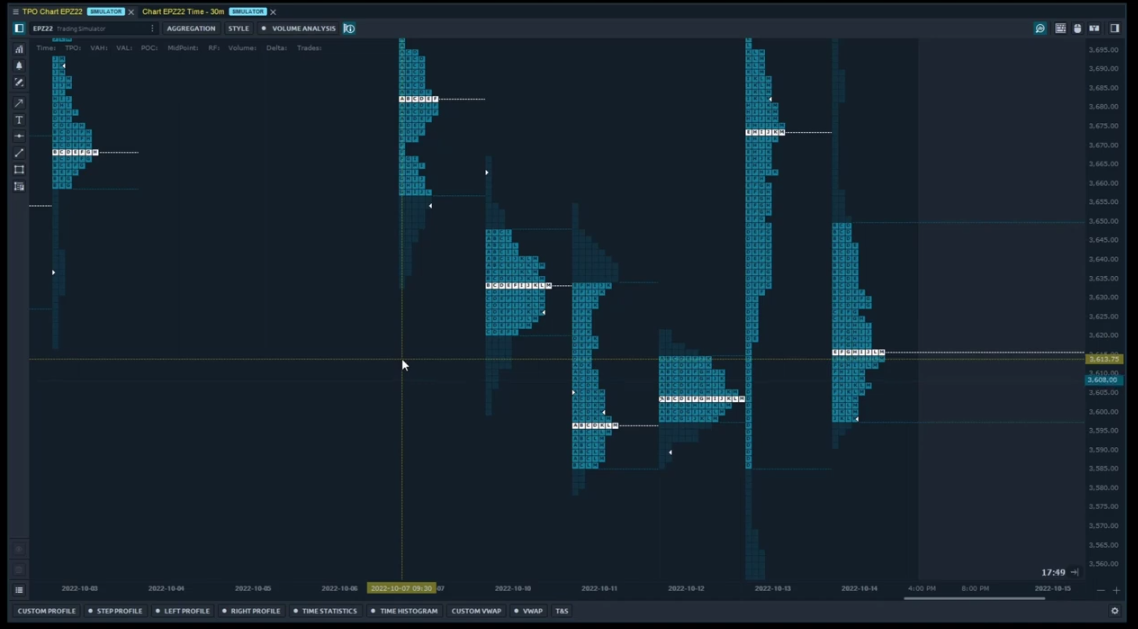
Adjust Block Sizes: The default setting typically represents time intervals of 30 minutes per block. However, depending on your trading frequency and the level of detail you need, you might adjust this to shorter or longer periods.
Each block size adjustment provides a different perspective on market activity, from high-detail views suitable for scalping strategies to broader views ideal for swing trading.
Configure Display Preferences: TradingView’s TPO charts allow you to choose how blocks are displayed—either stacked vertically by default or arranged according to different segments of the trading day.
This flexibility highlights the distribution of trading activity during specific periods.
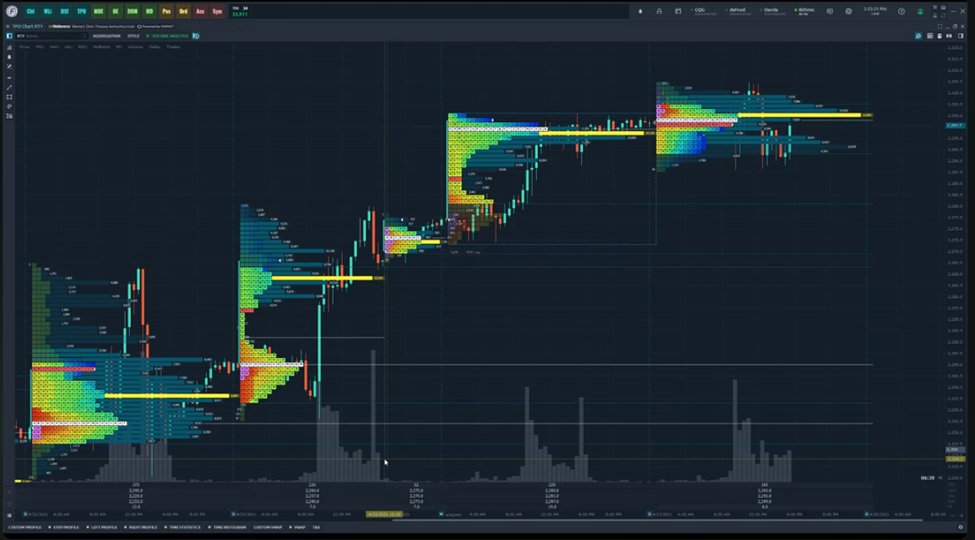
Set Color Coding and Letters: Customize the color scheme and the lettering of TPO blocks to suit your visibility preferences and to differentiate easily between different segments of the trading day.
Each letter corresponds to a specific time period within the trading session, making it easier to track how price levels evolve.

Linking with Volume Profile: For an integrated analysis, combine TPO charts with a volume profile, which is often included in the TPO chart setup on Optimus Flow, our free trading platform available to all customers.
This shows not only the time-based distribution of trades but also the volume traded at each price level, providing a dual insight into market strength and potential support or resistance areas.
Practical Tips for Using TPO Charts with Optimus Futures
When trading futures with Optimus Futures, leveraging TPO charts can significantly enhance your analytical capabilities:
Market Entry and Exit Points: Use the concentration of trading activity indicated by TPO charts to identify strong support or resistance levels, which can guide your decisions on entry and exit points.
Identify Market Trends: Analyze the progression of price levels throughout the trading day to discern potential trends or reversals in market sentiment.
Enhance Risk Management: By understanding where the bulk of trading activity occurs, you can better manage your risk, placing stops and limits around key TPO levels that have shown significant trading activity.
Setting up and customizing TPO charts on TradingView provides a robust framework for traders to analyze market dynamics more effectively.
Optimus Futures clients gain a competitive edge with these charts by visualizing detailed market behaviors that inform smarter, data-driven trading decisions.
Strategic Integration with Optimus Futures
Leveraging Time Price Opportunity (TPO) charts through TradingView while trading on Optimus Flow offers traders a definitive competitive edge, enhancing analytical depth and trading precision.
Here’s how the integration of TPO charts with Optimus Futures’ advanced trading capabilities can transform your trading approach:
Real-Time Data Access
Optimus Futures integrates seamlessly with TradingView, providing traders with direct access to real-time data across major exchanges like CME, CBOT, and NYMEX.
This integration allows traders to use the dynamic data visualization offered by TPO charts to make informed decisions quickly.
Real-time data is crucial for accurately interpreting market movements and timing trades effectively, particularly in fast-moving futures markets.
Direct Execution from Charts
TradingView’s advanced platform features enable direct trade execution from the charts. This is significantly streamlined using TPO charts, where traders can directly interact with the visual data.
Whether it’s identifying a high-volume price level or a significant pivot point on the chart, traders can initiate trades instantly without switching between analysis and execution platforms.
This saves time and reduces the risk of slippage between decision and action.
Customization and Advanced Trading Tools
Futures traders can tailor their TPO chart settings to match specific trading strategies, adjusting elements like the size of TPO blocks or the period under review to better align with their trading timeframes and goals.
Specific Advantages of Using Optimus Futures:
Live Data Feeds and Analytical Tools: Optimus Futures offers live data feeds and sophisticated analytical tools that complement the TPO charts on TradingView. These tools are designed to offer deeper insights and a richer analysis of price movements and market trends.
Customer Support and Educational Resources: Optimus Futures is committed to supporting traders through dedicated customer service and a wealth of educational resources. This includes dedicated support and personalized on-boarding so you can focus on utilizing TradingView features to optimize your trading strategies.
Enhanced Risk Management: The combination of TradingView’s analytical capabilities with Optimus Futures’ trading infrastructure supports superior risk management strategies. Traders can set more precise stop-loss orders and take advantage of advanced risk analysis tools directly within the TradingView platform.
Bottom Line
Time Price Opportunity (TPO) charts are a dynamic tool in the arsenal of traders who require a deeper insight into market dynamics.
When used in conjunction with Optimus Futures’ robust trading capabilities, TPO charts enrich your analytical approach, potentially leading to higher trading accuracy and efficiency.
Whether you’re a day trader looking to capture quick moves or a longer-term trader monitoring broader market trends, integrating TPO charts into your strategy can provide the clarity needed to make informed trading decisions.
Trading Futures and Options involves substantial risk of loss and is not suitable for all investors. Past performance is not necessarily indicative of future results.