This article on Pivot Point Trading is the opinion of Optimus Futures

The Evolution of Pivot Points
Before the 1990s, electronic charting systems were not widely available. They’ve been around since the 1970s, and some of the bigger financial institutions had them, but when it came to trading in the commodity pits, most traders used the old-school system: open outcry.
But even the older approaches had their own set of old-school technologies. And some of those technologies were adopted in the current digital age of trading.
One such “technology” is the system of pivot points.
Although pit traders had no access to charting systems while on the floor, many used pivot points to identify support and resistance and other key price levels where the market may shift direction.
How Long Have Pivot Points Been Around?
Think of the era of top hats and steam engines. Floor traders developed pivot points in the Chicago Mercantile Exchange around the late 19th century.
It was like an “open source” code, where different traders helped develop the calculations for the pivot points we know today.
In the US, pivot points are considered one of the oldest forms of technical analysis.
Are Pivot Points Still Relevant Today?
The short answer is “yes.” Traders still use pivot points, but today there are several variations that the original “floor trader” or traditional pivot points user did not have access to. In our experience the most popular among them are…
Woodie Pivot Points: Similar to traditional pivot points, this variation places more weight on the current period’s close price.
Camarilla Pivot Points: Based on the Camarilla equation, this variation has a slightly different way of estimating potential intraday support and resistance levels.
Fibonacci Pivot Points: This variation uses Fibonacci ratios to calculate potential support and resistance.
DeMark Pivot Points: Developed by Tom DeMark, a well known market technician and developer of indicators and systems, this variation works in conjunction with several of DeMark’s technical tools (you’d have to study this further to get a good gist of how it works within the context of his approach).
Why do traders still use pivots? One reason is that they’re relatively simple to understand and use. They’re also available on most charting platforms. They’re also flexible and can be used alongside other technical indicators.
What Are the Pros and Cons of Using Pivot Points?
The Pros:
- Simple to understand and easy to use
- Support and resistance levels are clearly visible
- Pivots are included in most charting platforms
- Easy to combine with other indicators
The Cons:
- Since pivots are based on past prices, they may not accurately reflect current market developments.
- In volatile markets driven by new developments or unexpected events, pivots might provide false indications.
- Pivots are not capable of indicating the “strength” of an underlying trend
- Since they’re widely used, many traders may be using pivots to try and attempt to predict price action, blunting some of the advantages they present
Trading Pivot Points
Pivot points can be customized to adapt to different trading approaches. In fact, customizing an indicator is arguably the first step to developing a unique trading strategy.
In light of this, this post covers three ways to think about and use pivot points.
- The first concerns pivot points and the concept of market equilibrium and using pivots in an attempt to predict potential market movement.
- The second concerns accuracy using weekly pivot point charts and how to use pivot points in day trading
- The third highlights three strategies for pivot points in a short-term trading context.
Pivot Points – How to Trade Around Daily Equilibrium
Recent headlines are agog with one word: PIVOT….have a look:
- Investors are hoping a Fed pivot will come soon. But this Fed president says, “not so fast.” – Fortune.com
- Markets too optimistic about Fed pivot prospects – investmentweek.co.uk.
- ‘Fed Pivot: Market is Swinging wildly as Investors speculate on Powell – Bloombergwealth.
What is Pivot, after all, and why is it important in financial markets and particularly in the field of technical analysis?
The Oxford definition of Pivot is – the central point, pin, or column on which something turns or balances. So, you can think of a pivot point as a region of balance.
It’s All About Equilibrium
How does it work? Pivots theoretically identify areas of equilibrium where buyers and sellers agree to fair value.
The pivot point thus acts like a “magnet” until proven otherwise; a new value area emerges and guides future buyers and sellers.
But is it really “fair value”? If you assume that fair value is what the market agrees on, then it’s correct. The big caveat is that fair value changes over time. And sometimes, it shifts rapidly.
Pivot points attempt to fix a fair value level for a given session.
We’re using daily pivots in the case below, so fair value is fixed for the “day” only.
How to Try and Use Pivot Points as a Predictive Tool
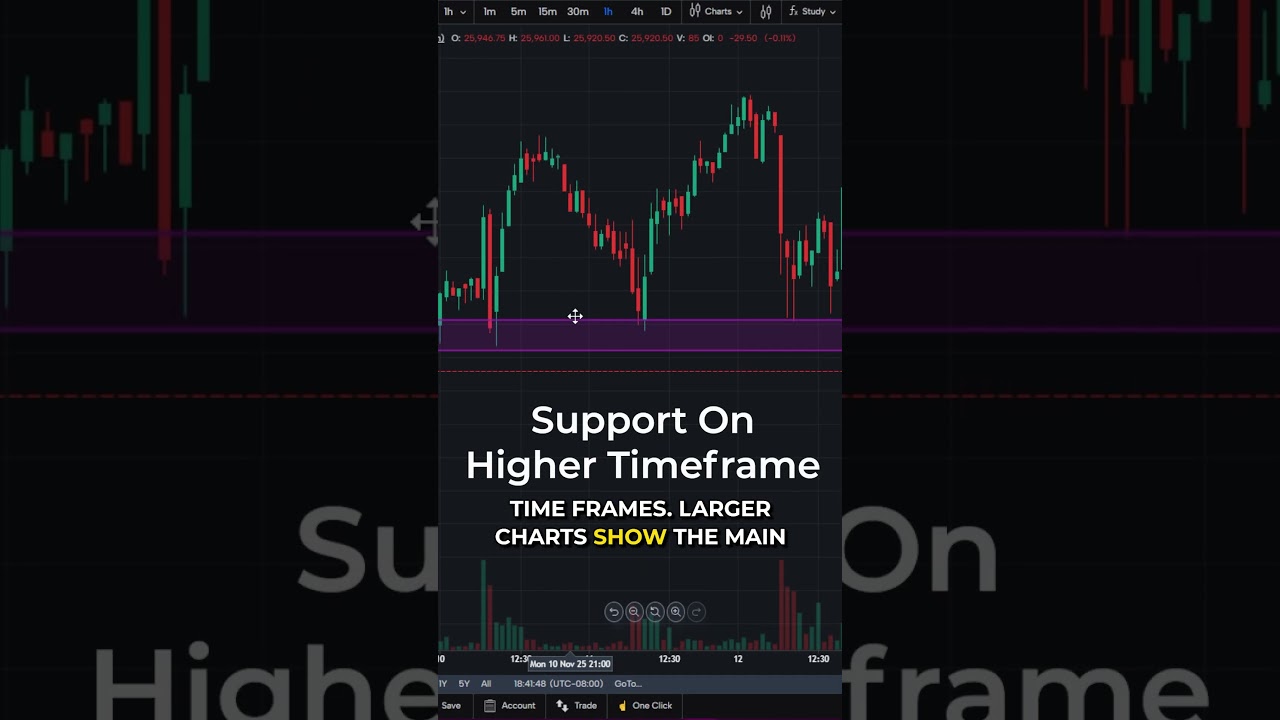
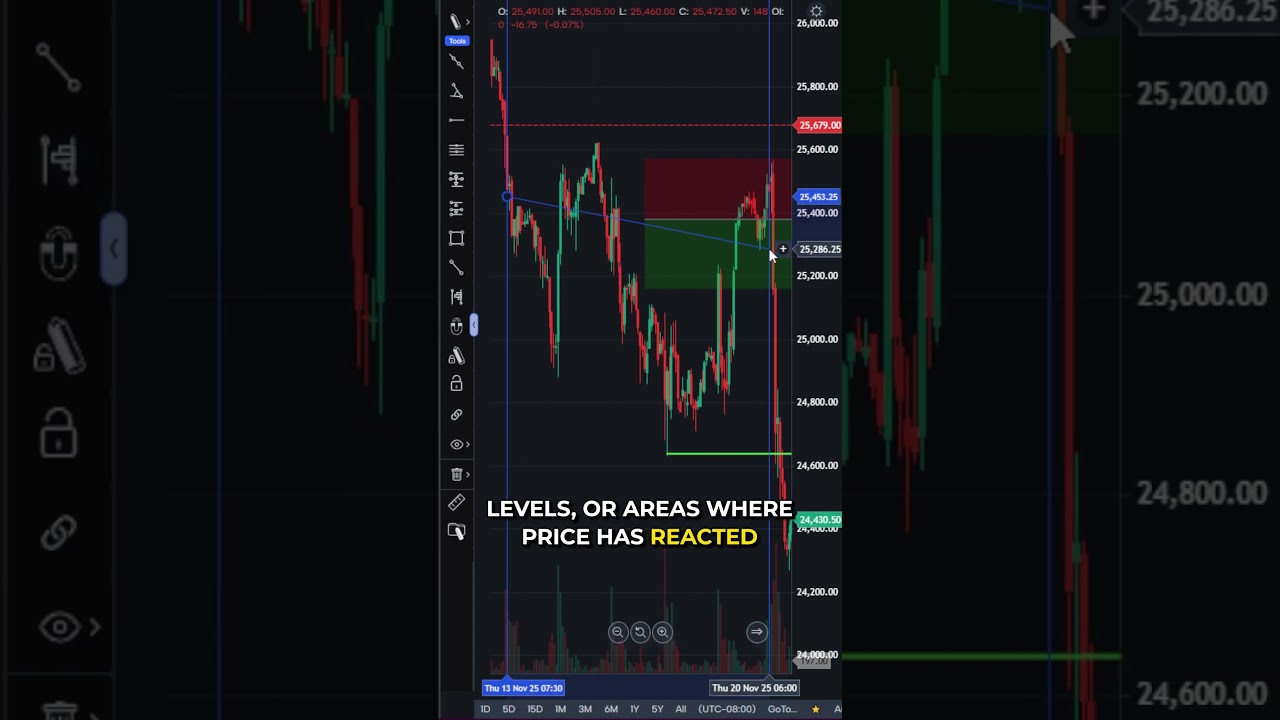
Pivot points provide valuable insight to traders who closely watch price levels to understand potential support and resistance point or areas.
Since pivot points are derived from the prior period’s high, low, and close, they give an early indication of support and resistance for the upcoming session.
In short, they’re “anticipatory,”
As the emotions of fear, greed, and uncertainty continue to dominate traders’ psychology, pivot points serve as key levels for making trading decisions.
As the possibility that these dominant emotions will continue to rule in the future, pivot points have become a valuable tool in identifying entry and exit criteria objectively.
In most cases, prices that reach levels of S1 and R1 (see below for more on how to calculate pivot points) are considered ahead of fair value and often fall back toward the pivot. Let’s look at the Micro E-mini Nasdaq (MNQ) below.

R1 prompts sellers to jump in at the start of the trading day [1]. There is a minor response to prices reaching S1 at [2].
That response continues, causing prices to bounce back up three times on the following day [3].
Once the price reaches R1, you see a counter response, pushing prices back down [4]. In the third trading session on the chart, you see two bounces again at S1 [6].
And on the final session, you see strong downward pressure at R1 at [6].
Even if the technical or fundamental conditions proved more compelling than the pivot points themselves, the pivots nevertheless elicited a market response, making them a useful tool for any short-term trader looking to anticipate price action.
If you want to try these various approaches, first try them in simulation mode. Click here for a free Optimus Flow platform demo and try it before you use it in a live market setting.
The Takeaway
Pivot Points elicit responses.
The market may eventually disagree with the points, but the fact that they compel some response makes them a valuable point of reference that any trader can use when day trading a given market.
How to use Pivot Points to Day Trade with Greater Accuracy
Pivot points are like an altitude gauge for the markets
Just imagine yourself as a pilot flying without a barometric altimeter. Not the safest feeling. When visibility is comprised, you can’t tell whether you’re flying too high or too low.
The same can be said for markets that are moving higher or lower in a volatile fashion. You know there’s the potential for a counter-reaction or a bounce, but where?
As a trader, you may not be able to monitor everything that can play into the probabilities of market movement. Still, you can measure altitude with regard to price levels as they unfold.
That’s what Pivot Points are for.
A Near-Term Price Move Gets Ahead of Its Valuation
In the near term, prices can be overbought or oversold. But relative to what, exactly? You can use various indicators to speculate when prices might be approaching either level.
Oscillators can help. Support and resistance can also help.
Another idea might be to use an “old school” method: pivot points.
The problem is that it can get messy and confusing if you superimpose daily pivot points on top of a chart where you’ve deployed other indicators.
So, here’s a practical tip to consider: why not use weekly pivot points to plot your reference points on a much larger time scale?
In this way, particularly if you’re a day trader, you can chart short-term setups while using the pivot points to serve as longer-term thresholds.
Another benefit is that you can set your pivot levels for the entire week in a way that doesn’t disrupt your day trading.
What are Pivot Points in Trading
In its simplest form, pivot points are price levels that help you determine areas of support and resistance.
Standard pivot points consist of two levels of support (S1 and a lower one at S2), a pivot point (P) in the middle that indicates bullish and bearish areas (above and below), and two lines of resistance (R1 and a higher one at R2).
A simplistic take of the middle line (the pivot) is that prices above the line are considered bullish, while below, they may be considered bearish.
Real markets don’t operate that way, but pivots provide (at least) some reference.
This is how a pivot point might appear on a chart
- R2 (resistance 2)
- R1 (resistance 1)
- P (pivot point)
- S1 (support 1)
- S2 (support 2)

How to Calculate Pivot Points
- Second resistance: R2 = P + (R1-S1)
- First resistance: R1 = (2 * P) – Low
- Pivot point: P = (High + Low + Close)/3
- First support: S1 = (2 * P) – High
- Second support: S2 = P – (R1 – S1)
Now that we know what pivot points look like and how to calculate them, how do we interpret them, and why should we use “weekly” pivot points, possibly in conjunction with daily and monthly pivot points?
Why Use Weekly Pivot Points?
If you’re a day trader using smaller time-frames, like a 5-minute or 15-minute chart, then there’s no way you can see the broader context unless you take the time to plot it out on your chart.
It’s easy to miss critical support and resistance levels that may have shown up days or weeks ago if all you see on your charts is short-term action.
It helps to plot out critical levels (support/resistance, or oversold/overbought) on a broader scale so that you can anticipate “turbulence,” so to speak, and not get shaken by surprise when it does take place.
Plus, it’s also like taking an altitude measurement, where you might estimate whether you’re trading at a level too high or about to hit a conditional ground of support.
How Might You Interpret Weekly Pivot Points?
Note that we will combine weekly with daily and even monthly pivots. What we’re looking for here is “convergence.” Here are a few tips:
Analysis:
- Consider the range of S2 to R2 not as support and resistance but as potential oversold (S) and overbought (R) areas.
- Check the S2 to R2 range across daily, weekly, and monthly periods: If two values are close together, then consider these levels “critical.:
- When markets quietly anticipate a major economic report, look for daily R1 and S1 levels to hold and for the market to return to the daily pivot.
- Moves beyond R1 or S1 usually don’t guarantee breakouts. Chart patterns define breakouts, not pivot levels!
- Historical odds suggest that the entire week’s price action will occur between weekly R2 and S2, so watch out for price action that looks to go beyond these levels.
Trading:
- Be careful if going long when the market moves above weekly R2 (its overbought level) or going short when the price moves below weekly S2 (its oversold level).
- Instead, you might consider going short at weekly R1 or long at weekly S1, using the weekly pivot as your profit target.
- You might consider going long at weekly S2 or short at weekly R2 with a weekly S1 or R1 profit target.
Example of Weekly Pivot Points in Action
Notice how the price on the 15-minute charts responds to the S1 line. The S1 line converges with the previous month’s low, making it a strong case for any day trader to go long rather than go short.
The Takeaway
Pivot levels can make for reliable reference points. If most action statistically takes place between a weekly S2 and R2, then it provides an important potential threshold (or box) for your day trading for the week.
This means you should pay close attention when the price flirts with those levels, as they may offer strong buying or selling opportunities. Remember that price patterns are where to find breakouts, not pivot points.
Also, pivot points are fixed levels, so monitor the larger technical and fundamental picture to monitor any changes in the trading environment.
Three Pivot Point Trading Strategies for Day Trading
Of all the technical analysis indicators, pivot points have become one of the most used for both the simplicity of their calculations and their easy-to-implement strategies.
Indeed, just inserting the pivot points and the supports/resistances that come with the calculations onto a chart will give a day trader multiple strategies to follow.
Pivot Point Trading Strategy 1 – Using the Pivot to Trade Bullish/Bearish Directionality
The easiest and most straightforward way to trade pivots is to see where prices are compared to the main pivot point, take the position accordingly and place the stop a few ticks near the pivot in the opposite direction of your trade.
Your target would be the next pivot level.
For example, the EUR/USD futures (6e) began gaining bearish momentum upon reaching the pivot line.
A trader might have taken a short position, placing a stop loss a few ticks above the highest candle that penetrated (but failed to break above) the pivot line.
A conservative exit point would have been S1, the next pivot point level.
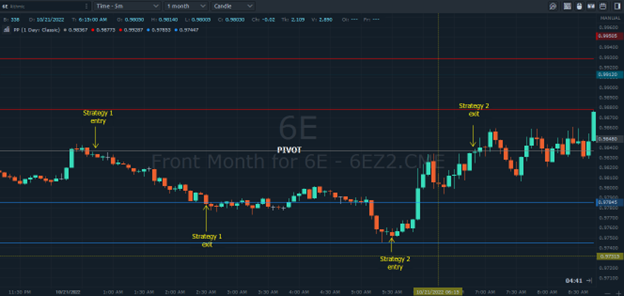
Pivot Point Trading Strategy 2 – Trading the Bounce off S2 (or R2)
Most trading action occurs between S2 and R2 when using daily pivot points. This means that S2 may be considered an “oversold” level while R2 may be considered an “overbought” level.
In strategy two above, a long position is taken as prices bounce off S2. A stop loss is placed a few ticks below the lowest candle to penetrate S2.
The profit target could be S1, or the pivot point itself, as the pivot line represents “equilibrium” in price, or fair value, at least for the day.
Pivot Point Trading Strategy 3 – Trading Chart Patterns Coinciding with Pivots
Here’s an important rule of thumb: chart pattern breakouts take precedence over pivot point breakouts. But if pivot point and chart pattern breakouts coincide, you may have a stronger case to trade a breakout.

The Micro E-mini WTI Crude Oil futures (MCL) chart shows us a broadening top pattern.
In this pattern, the price can break out in either direction though 60% of the time, it breaks upward.
A trader might have entered the position at the breakout, using R1 as a profit target, as prices tend to bounce off R1 levels (not as strongly as R2 levels, but a market reaction does often happen.
Note: If you weren’t using pivot points to plot your profit target, you might have used the broadening top profit measure instead.
This means taking the height of the widest part of the pattern and placing anywhere from 60% to 100% of the pattern as your profit target.
In the case above, S1 gave you a clear target to use.
So, in a way, using pivot points in conjunction with the chart pattern gave your trade setup more clarity than simply using one or the other technical setups alone.
The Bottom Line
As you can see, pivot points strategies are ideal for day traders, as they are very easy to use and can often be quite rewarding. Just remember that several other factors affect market dynamics as well.
Some of these other factors may take precedence over pivot points, so be prepared to adjust your strategies should any of these factors (fundamental or technical) occur.
There is a substantial risk of loss in futures trading. Past performance is not indicative of future results.