This article on Support and Resistance Trading is the opinion of Optimus Futures.
Support and resistance trading gives futures traders a structured framework for identifying high-probability trade locations, optimizing risk, and forecasting reversals and breakouts across all market conditions.
Introduction: Why Support and Resistance Trading Matters
Support and resistance levels show where buyers and sellers consistently step in, creating natural turning points on the chart. For futures traders, these areas matter because they help you define tight risk, clear invalidation levels, and strong reward-to-risk setups.
Since futures markets use centralized volume and standardized contract specs, support and resistance analysis works especially well here. Whether you’re trading ES, NQ, CL, or GC, knowing where price is likely to react gives you a major advantage.
This guide walks you through the core concepts, practical strategies, and advanced techniques that active futures traders use every day.
Quick Reference: Support & Resistance Specs
| Metric | Specification |
| Primary Application | Futures day trading & swing trading |
| Optimal Timeframes | 15-min to Daily (Multi-timeframe alignment recommended) |
| Risk-Reward Target | Minimum 1:2 at major levels |
| Best Market Conditions | All conditions; strongest in consolidation/range |
| Stop Loss Placement | 0.5–1.0 ATR beyond the S/R zone |
| Capital Efficiency | High — precise entries reduce drawdown exposure |
What Are Support and Resistance Levels?

Definition: Support and resistance are price zones where the balance of buying and selling pressure creates predictable pauses, reversals, or momentum accelerations.
Support: The Market Floor
Support forms at price areas where demand consistently absorbs selling pressure. Strong support often exhibits:
- Multiple historical reactions.
- Volume inflows (aggressive buying).
- Long lower wicks indicating rejection of lower prices.
- Bid absorption by larger institutional players.
Resistance: The Market Ceiling
Resistance forms where supply overwhelms demand. These levels often serve as:
- Profit targets for longs.
- Short-side entry zones.
- Areas to reduce long exposure.
Role Reversal (Polarity Principle)
Once price breaks above resistance, traders often expect that level to become support upon a retest (and vice versa). This psychological shift is key to avoiding false breakouts.
Types of Support and Resistance
1. Horizontal Levels
These are price zones where the market has reversed multiple times, making them extremely reliable—especially on higher timeframe charts (Daily/Weekly).
2. Zones vs. Lines
Support and resistance function best as broader zones, not precise prices. Leveraged markets are noisy; treating a level as a single tick often results in premature stop-outs.
Typical Futures Zone Sizes:
- ES (S&P 500): 5–10 points
- CL (Crude Oil): $0.50–$1.00
- GC (Gold): $8–$12
NEW: Three-Level Zone Structure
(Aggressive → Conservative)

This advanced concept helps fine-tune entry timing based on risk tolerance.
- Aggressive Zone: The leading edge. Used for early rotation attempts in strong trends. High risk, high reward.
- Neutral Zone: The middle of the band. Standard reaction area.
- Conservative Zone: The back edge of the zone. Safest location for institutional-level reversals or “stop hunts.”
3. Trendlines and Channels
Trendlines provide dynamic diagonal support and resistance. Channels create structured trading environments for both trend following and range-bound strategies.
4. Psychological Round Numbers
Major levels like ES 4500, CL 80.00, and GC 2000 attract both human psychological attention and algorithmic order clustering.
5. Dynamic Indicator-Based Levels
These adaptive tools frequently serve as real-time S/R:
- 50-day & 200-day Simple Moving Averages (SMA)
- Daily Pivot Points
- VWAP (Volume Weighted Average Price)
Resource: Explore more in our guide to the Best Trading Indicators for Day Trading Futures.
How to Identify High-Probability Levels
Visual Chart Analysis
Start with higher timeframes (Daily, 4H) to map structural levels. Then refine these zones on your execution timeframe (15m, 5m).
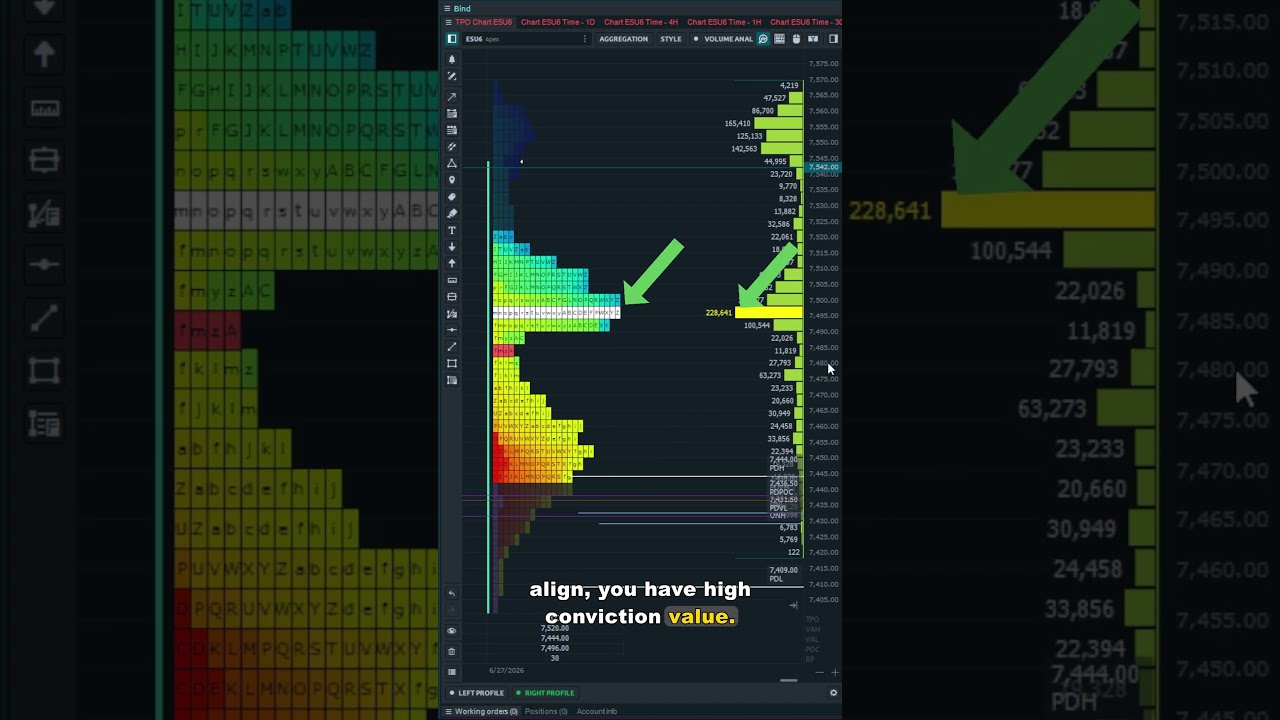
Volume Profile Analysis
Volume Profile shows where meaningful trading occurred, not just price movement.
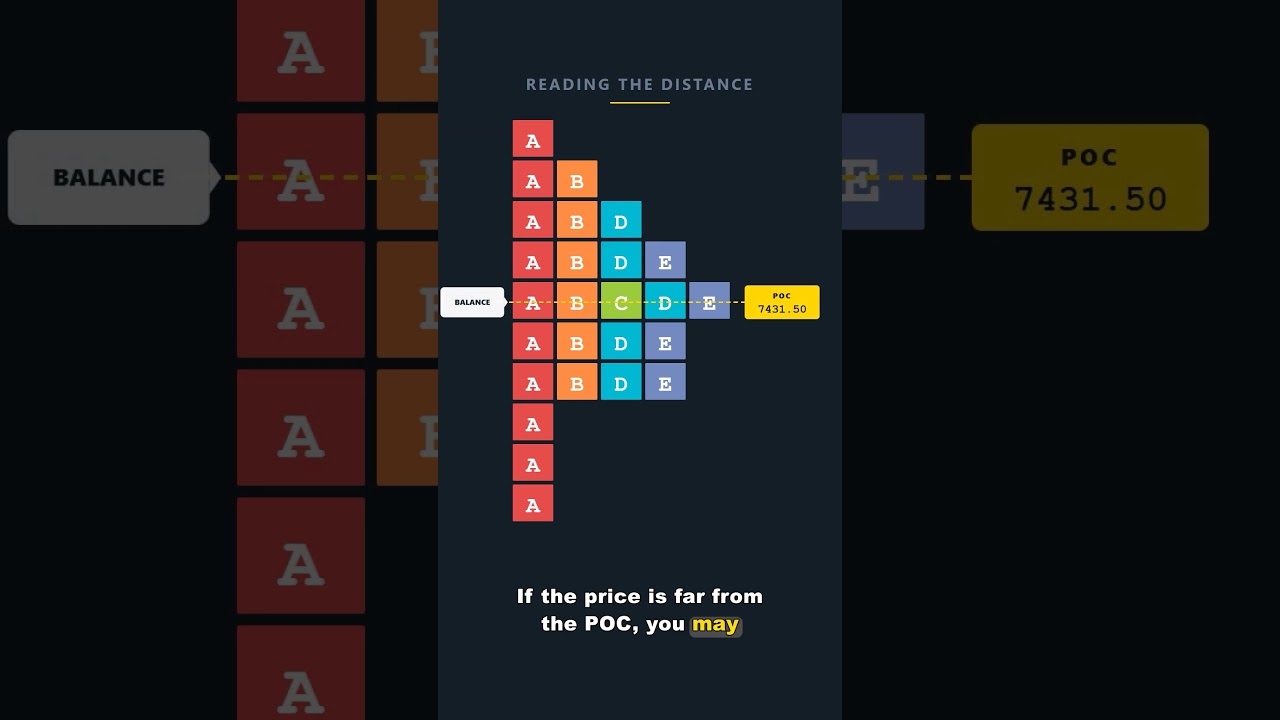
- Point of Control (POC): The price level with the highest traded volume.
- High Volume Nodes (HVNs): Areas of value acceptance (Support/Resistance).
- Low Volume Nodes (LVNs): Areas of rejection where price often accelerates.
Deep Dive: Visit our guide on Spotting Market Trends with Volume Profile.
Fibonacci Retracements
Fibonacci levels (38.2%, 50%, 61.8%) frequently align with structural support and resistance zones, creating “confluence.”
Learn: How Fibs interact with structure inside our complete Guide to Fibonacci Trading.
Candlestick Pattern Confirmation
Never trade a level blindly. Look for confirmation:
- Pin Bars (Rejection)
- Engulfing Patterns (Momentum shift)
- Dojis (Indecision before breakouts)
Read: Discover these patterns in our Ultimate Guide to Price Action Trading.
Bodies vs Wicks (Higher Timeframe Structure)
When drawing zones on higher timeframes (Daily/Weekly), candle bodies often create more reliable S/R levels than wick extremes, as bodies represent the closing consensus of value for that session.

Proven Support & Resistance Trading Strategies
1. Range Trading Strategy
Best for: Sideways/Consolidating markets.
- Identify: A defined range (3+ touches on boundaries).
- Action: Buy support / Sell resistance.
- Trigger: Wait for rejection candles (wicks).
- Risk: Place stops just outside the zone.
- Target: Minimum 1:2 Risk-Reward Ratio.
2. Breakout Trading Strategy
Best for: Trending environments or news events.
- Identify: A watched level tested repeatedly (absorption).
- Trigger: Clean candle close beyond the level + 50%+ Volume Expansion.
- Action: Enter on the breakout or waiting for the retest.
- Risk: Stop loss placed back inside the old range.
Strategy: Explore more setups in our guide to Futures Trading Strategies.
3. Role Reversal Strategy
Instead of chasing an impulsive breakout, wait for price to return to the broken level. If the old ceiling becomes a new floor, enter Long.
4. Multiple Timeframe Confirmation
Levels visible on Weekly + Daily + 1H charts carry exponentially more weight than single-timeframe levels.
Mastery: Learn more inside Price Action Trading Secrets.
Advanced Techniques for Experienced Traders
Confluence Zones
High-probability setups occur when multiple independent factors overlap at the same price:
- Horizontal Level +
- Moving Average (Dynamic) +
- Volume Node (HVN) +
- Fibonacci Retracement
Reading Institutional Order Flow
To see if a level will hold, sophisticated traders look “inside” the candle using Footprint Charts, DOM (Depth of Market), and Time & Sales:
- Absorption: Heavy volume trading without price movement.
- Iceberg Orders: Hidden liquidity reloading at the bid/offer.
- Block Prints: Large institutional transactions defending a level.
Guide: Learn more in our Footprint Charts: A Complete Guide.
Market Microstructure Notes
- ES (S&P 500): Respects levels best during Regular Trading Hours (RTH).
- CL (Crude Oil): Volatile; requires wider zones to avoid wicking out.
- GC (Gold): Highly sensitive to USD flows and round numbers.
Risk Management Essentials
Stop Loss Placement
Do not place stops directly on the level.
- Best Practice: Place stops 0.5–1.0 ATR (Average True Range) beyond the S/R zone.
- This avoids “stop runs” where price pierces the level to grab liquidity before reversing.
Position Sizing Based on Zone Width
- Position Size = Account Risk $ ÷ (Entry Price – Stop Price)
- If the zone is wide, trade fewer contracts. If the zone is tight, you can trade more size while keeping dollar risk constant.
Scaling Out
- 50% at minor resistance (First Target).
- 30% at major structure level.
- 20% runner with a trailing stop.
Frequently Asked Questions
Strong levels are identified by multiple touches over time, alignment with higher timeframe levels, and confluence with volume profile zones or moving averages. Prioritize areas where price has reversed at least 2-3 times and that are visible on Daily or Weekly charts.
A level is a specific price point (e.g., ES 5000), while a zone is a broader range (e.g., ES 4995-5005). Zones are more practical for futures because leveraged markets rarely respect exact prices due to volatility and stop hunts.
No. Place stops 0.5-1.0 ATR beyond the S/R zone to account for normal volatility and avoid “stop hunts” where price briefly pierces levels to trigger retail stops before reversing.
Confirm breakouts with three factors:
1 – Volume Expansion: 50%+ above average.
2 – Decisive Close: Candle body closes beyond the level.
3 – Follow-through: Momentum continues on the next 1-2 candles.
Support & Resistance Trading Cheat Sheet
| Category | Checklist Item |
| Level Identification | ✓ Mark Daily/Weekly swings ✓ Use zones, not lines ✓ 2–3 touches minimum ✓ Volume Profile confluence ✓ Psychological levels |
| Trade Entry | ✓ Confluence (Structure + Indicator) ✓ Candle confirmation (Rejection) ✓ Volume expansion ✓ Multi-Timeframe alignment ✓ Defined invalidation point |
| Risk Management | ✓ ATR stop buffer ✓ Position size calculated by zone width ✓ Minimum 1:2 Risk-Reward ✓ Scale out plan ✓ Avoid >2% risk per trade |
| Common Mistakes | ✗ Stops placed exactly on the level ✗ Trading every touch blindly ✗ Ignoring higher timeframes ✗ Over-leveraging ✗ Chasing weak breakouts |
Conclusion
Support and resistance analysis remains foundational for futures traders. Understanding how institutional order flow interacts with these areas dramatically improves consistency, discipline, and profitability.
By combining these principles with the advanced tools available on Optimus Flow—such as Volume Profile and Footprint charts—you can elevate your trading approach from guessing to precision execution.
Next Steps with Optimus Futures
Explore the Optimus Futures Learn Center – Structured courses, platform guides, and trading foundations.
Try Optimus Flow (Free for Clients) – Get access to Footprint charts, DOM, Volume Profile, and advanced analysis tools.
Open a Live Futures Trading Account – Experience low margins, deep discount commissions, and premium support.
Disclaimer: Futures trading involves substantial risk of loss and is not suitable for all investors. Past performance is not indicative of future results. Support and resistance analysis does not guarantee profitable trades.