The debate about trading indicators and their usefulness is probably as old as trading. Nevertheless, there are numerous misconceptions when it comes to understanding and using indicators. In the following article, we discuss the concepts of indicators that pose the greatest challenges for traders and that often lead to wrong assumptions, ongoing frustration and what we call “riding the learning curve” which can have disastrous consequences for traders.
All graphs and performance figures are for illustration only. There is a substantial risk of loss in futures trading. Past performance is not indicative of future results.
[bctt tweet=”Too Many Technical Indicators Can Misguide You as a Trader #trading #futures $STUDY $ES_F “]Indicators vs. price action
This is, without a doubt, the most frequently talked about topic when it comes to using technical indicators and there are mainly only two types of traders: the ones who glorify indicators and cannot trade without them, and the price action traders who have no use for indicators whatsoever.
However, once you understand that indicators do nothing but take the price information from you charts, apply formulas to it and visualize the data in a specific way, you can escape these general misconceptions. In their essence, indicators and price action (by this we refer to the price information that you can see on your charts) are essentially the same, just in different formats. Therefore, the debate whether one is superior over the other is redundant. On your path to a professional and well-rounded trader, it is important that you unlearn the ignorant mindset many new traders have and that put them in a blind-spot where they misinterpret information.
Do you understand your tools?
Far more more import than discussing the usefulness of indicators is that you have to understand the trading tools that you consult to make a trading decision. Usually, traders just randomly pick an indicator, place it on their charts and then try to make use of it without really understanding what they are looking at. If you want to use indicators in your trading, your goal should be to understand how the indicator transforms price data into visual information. Study its formula, understand all its nuances and why it does what it does.
Indicator-paralysis
Indicator-paralysis exists because traders arbitrarily add indicator after indicator to their charts because they believe that the more indicators they have, the more efficient they can filter out “bad” and misleading trading signals. This approach usually results in paralysis when traders suddenly feel overwhelmed by the amount of information they have to process.
How many indicators do you really need?
Indicator-paralysis ties in with the previously discussed point. Do you understand your tools, what their purpose is and what they tell you? It is not uncommon to see that traders combine indicators in a way that underlines their ignorance. Although some charting packages already differentiate between ‘Trend’ (ADX, Bollinger Bands, moving averages,…) and ‘Range’ (Stochastic, MACD, RSI, ATR, ..) indicators, traders still often combine indicators that essentially provide the same information. Furthermore, traders rely on trend-indicators when price is range-bound, or try to make sense out of oscillators, when markets are trending; again, we come back to our previous point: know the tools you use to make trading decisions. If a trader chooses to use indicators, he should pick one indicator from each category to overcome indicator-paralysis and to avoid duplicate and misleading information.
The implications of hindsight bias
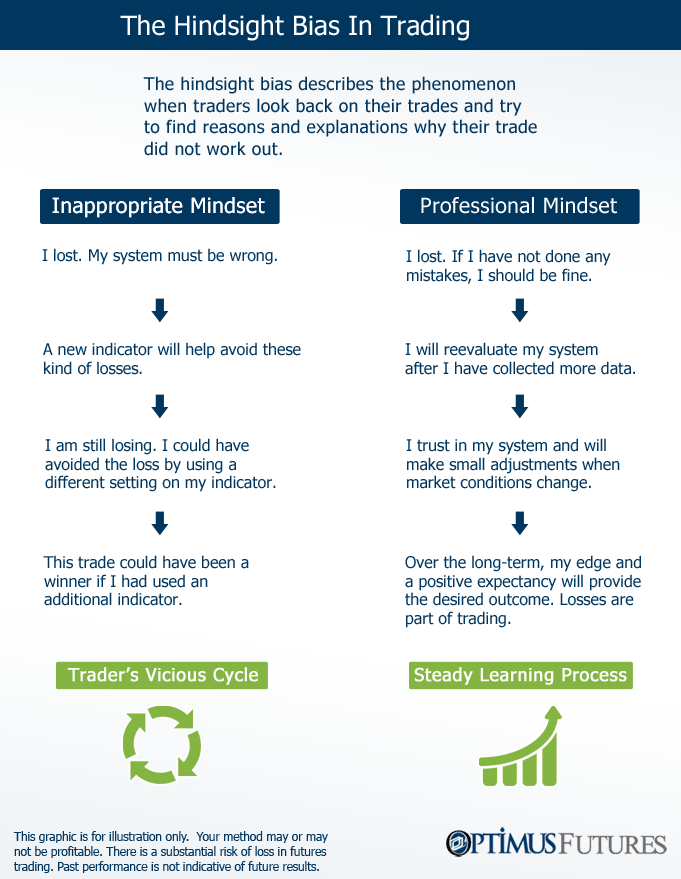
Hindsight can be very valuable on your path to becoming a better trader. However, there is a common mistake most traders make when it comes to evaluating past performance, which is called the hindsight-bias. It is essential that you accept and internalize that not all trades will be winners and that losing a trade is not necessarily the result of a “bad” trading strategy.
Your trading strategy may, or may not be profitable. There is a risk of loss in futures trading. Past performance is not indicative of future results.
Traders always look for reasons why a trade turned out to be a losing trade. In quest of answers, they arbitrarily alter indicator settings, add new indicators or seek for answers elsewhere until they have found a possible explanation why their signal was “not correct”. It is important to understand that you will always be able to find reasons why a trade did not work out if you just play around with indicators long enough. This brings us to our next point.
Riding the learning-curve
The wrong use of hindsight bias and constantly altering their trading approach is what leads most traders into the vicious-circle known as “riding the learning curve” or “system hopping”. To improve as a trader, it is vital that you pick one trading approach, follow it without major deviations and make small adjustments along the way. Completely changing your trading tools or making significant modifications to your trading approach can unravel all your progress so far. Just reevaluate for a moment how often you change your approach and when was the last time you made significant changes to the way you analyze your charts? Most trades will be able to see that they jump from one method to the next without ever really seeing a learning effect.
The Holy Grail is in the execution
The difference between an amateur and a professional trader is not necessarily defined by the indicators they choose or which entry signals they follow, but how they approach trading in general. The following points sum up what we have discussed and can provide guidance on your way to more consistent results and a professional mindset.
- First, it is important to understand that there is no significant difference between indicators and price information. Indicators just apply a formula to what you see on your charts and translate it into visual information.
- There are mainly two categories of indicators: trend and range indicators. Knowing which one to use in a specific situation and not applying too many indicators to avoid redundancy and indicator-paralysis is important.
- Understanding your trading tools and really knowing what they do and how they process information is inevitable.
- Constantly adjusting your indicators and the setting of your indicators based on the hindsight bias can lead to inconsistent results.
- Hindsight bias and exclusively judging your performance based on your recent trades can result in what we call “riding the learning curve”. Try to follow a consistent approach, don’t engage in”system hopping” and only make small adjustments along the way.
If you wish to learn about Optimus Futures, LLC broker assisted trading services or our performance based futures trading, please call us at 1-800-771-6748 local 561-367-8686 general@optimusfutures.com
Please be advised that trading futures and options involves substantial risk of loss and is not suitable for all investors. Past performance is not necessarily indicative of future results. This matter is intended as a solicitation to trade.


