This is the opinion of Optimus Futures.
The misunderstandings and misconceptions between volatility and momentum can lead to expensive trading mistakes and result in a flawed chart, market analysis, and trading decisions.
Volatility and momentum are two fundamentally different things. We will explore the differences between the concepts, how to measure volatility and momentum, and how to use them for effective trading decisions.
What is volatility?
Volatility describes how much price fluctuates around a mean. If you would use a moving average and see prices going back and forth around the moving average, markets are in a high volatility environment. Furthermore, if candlesticks have relatively long candle shadows compared to the candle body, it also signals a volatile market.
Thus, volatility is also often referred to as a risk indicator because high price fluctuations can signal indecision in the markets, and the powers between buyers and sellers are constantly shifting.
What is momentum?
To a certain degree, momentum is the opposite of volatility. During a high-momentum market period, price only moves in one direction, and the candlesticks do not have large shadows.
Momentum is often referred to as trend strength. In a ranging market, there is no momentum because price moves back and forth between two boundaries.
The strongest trend, therefore, has little to no volatility and a lot of momentum. A ranging market often has high volatility and low momentum. At the end of trends, you can often see volatility picking up when momentum declines.
“Short-term volatility is greatest at turning points and diminishes as a trend becomes established.” – George Soros
How to measure volatility?
There are different trading tools and concepts for analyzing and measuring volatility. We introduce the four most commonly used volatility tools.
ATR – Average true range. The average true range indicator is not a pure volatility indicator, but it analyzes candle size and how far the price has traveled on average during a given time period. A high ATR reading implies that the price moves farther, and a low ATR shows that price candles are narrowing in size.
Bollinger Bands. Bollinger Bands are probably the most commonly used volatility tool. The outer Bollinger Bands visualize the two times standard deviation of price. Widening Bollinger Bands show a high volatility market environment and Bollinger Bands that are narrow signal a contracting and low volatility market environment.
Candlestick shape. Often, it can be enough to look at pure price charts. Candles increasing in size and leaving long shadows signal high volatility. On the other hand, candlesticks with no wick and only going in one direction show less volatility.
VIX – Volatility Index. The VIX is used to measure broader market volatility, and it is also used to evaluate market sentiment and risk appetite. During higher-risk periods, the VIX climbs, and investors tend to become more conservative. A low VIX shows a higher risk appetite and less broad market volatility.

How to measure momentum?
The tools and indicators used to measure momentum differ greatly from the volatility tools. Although many traders confuse the two, knowing the trading tools you use to make trading decisions is essential.
RSI – Relative Strength Index. As the name implies, the RSI measures price strength. A high RSI shows that the trend is up and that there are little to no bearish price candles during a given period. The RSI compares the candlesticks (bullish vs. bearish) and the size of the candlesticks.
CCI – Commodity Channel Index. The CCI indicator measures how far the price is from a given moving average. Thus, a high CCI shows that the price has pulled away from a moving average. A CCI around 0 shows that the price hovers around the moving average.
Stochastic. Although Stochastics are often used as range indicators, in its essence it is a momentum indicators. The Stochastic measures how far the price has traveled and how close the price closes near the top or the bottom of a candlestick. Therefore, do not mistakenly believe that an overbought Stochastic indicator indicates that the price will reverse any minute – it might as well show a strong uptrend.
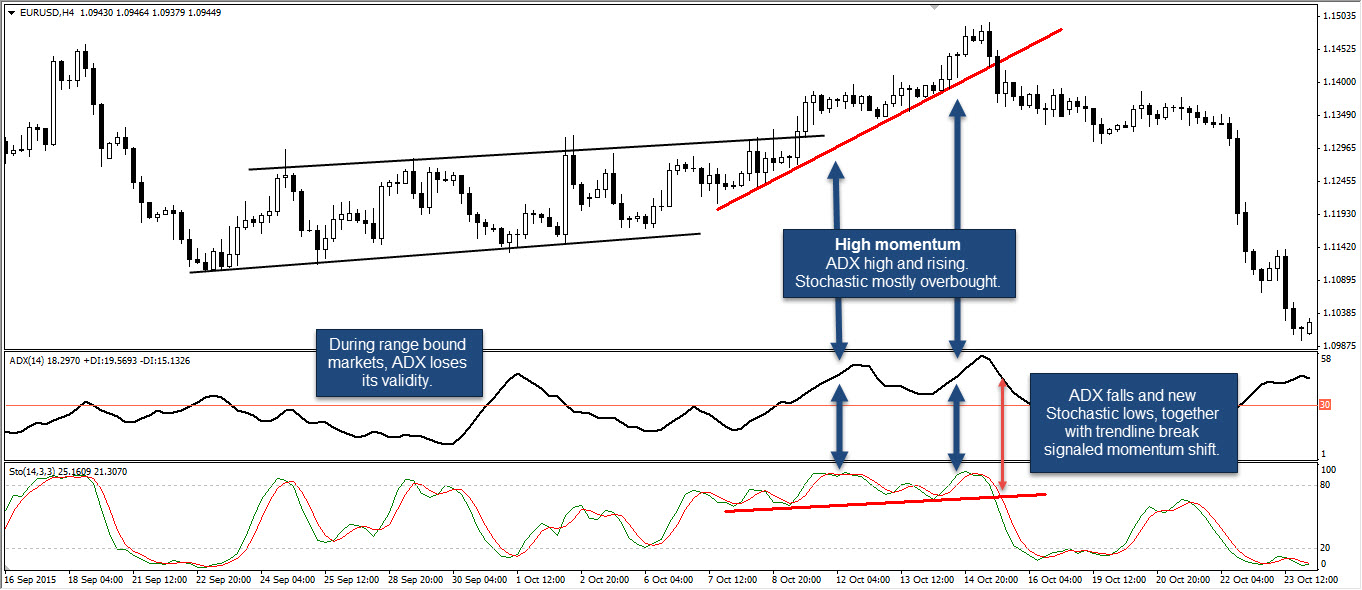
ADX. The ADX is THE trend strength indicator, often used to differentiate between range-bound, weak, and strong trends. Typically, a reading below 30 signals a range, whereas ADX values above 30 show a trend. A “hook” on an ADX can then indicate a potential trend reversal or fading momentum.
Candlesticks. All indicator information is derived from price analysis; therefore, you can only read trend strength from your price action charts. An uptrend with only bullish candles and little to no candle shadows illustrates a high-momentum trend.
How to use volatility
Reading the current market volatility is only one part of the equation. Afterward, the knowledge has to be used to make actual trading decisions.
Especially when it comes to adjusting trade parameters and order placement, volatility is the most important concept. Whereas a trader is better off using wider stop and take profit orders to avoid stop runs and capitalize on the larger market swings during high volatility, a more conservative stop and take profit placement should be applied when volatility is low.
Volatility is also used by professional traders to adjust position size. In a high-volatility market, stop-loss orders are typically set further away because market swings are greater. A wider stop-loss distance means that the absolute number of contracts must be reduced to achieve the same risk percentage.
How to use momentum
Momentum can be used in many ways, and here are the three most common ones when making trading decisions and analyzing price action.
Identifying trends. Momentum indicators are great when it comes to identifying the transition point from range markets to trending markets. A market in a tight range with a low momentum that suddenly shows increasing candle size in one direction and a rising momentum indicator can foreshadow the creation of a new trend.
Early warning signals and fading trends. During a trend, momentum indicators can signal fading momentum and provide early warning signals about potential trend reversals. A “hook” on a high ADX or divergences on the RSI or CCI can foreshadow potential reversals.
The likelihood of price action events. Momentum information is often used to determine the likelihood of certain events. For example, when the ADX is extremely high, and the Stochastics have been overbought for a long time, it is more likely to see support and resistance levels breaking because momentum is high. When the price is in a range, and the ADX is below 30, and flat, support and resistance levels tend to hold more often, and, at the same time, Stochastics will naturally not stay overbought/oversold too long.
Understanding the differences between volatility and momentum is essential to make correct trading decisions, and understanding market moves fully. Traders who do not understand how to use volatility and momentum information in their trading often find themselves in trades where risk can’t be managed, or they enter the markets on the wrong side.
There is a substantial risk of loss in futures trading. Past performance is not indicative of future results. The placement of contingent orders by you or broker, or trading advisor, such as a “stop-loss” or “stop-limit” order, will not necessarily limit your losses to the intended amounts since market conditions may make it impossible to execute such orders