This article on Momentum Trading Strategies is the opinion of Optimus Futures.
Editor’s Note: This article was originally published on August 15th, 2018, and has been updated for comprehensiveness.
- What Is Momentum Trading?
- Applying a Momentum Trading Strategy could be used by both novice and beginner traders.
- Both day traders and swing traders should use indicators to identify momentum.
Momentum trading strategy is based on the strength of a trend often reflected in the market’s continued movement and volatility. Momentum trading strategies could be used as trading indicators, chart patterns, or part of mathematical calculations.
Momentum is not a fundamental trading strategy, although you can justify any trading momentum on underlying fundamental factors.
This article will dig into the ins and outs of momentum trading, various chart techniques, and the technical tools to identify momentum day trading strategies.
Whether you are a beginner or a seasoned trader, momentum trading concepts should be part of your trading lexicon.
What is a Momentum Trading Strategy?
Momentum trading strategies are trading methods that are meant to assist traders in capturing a strong price move to the upside (buy signal-Long)in a bullish move and a downtrend in a bearish activity (sell signal-Short).
The trader can also use momentum to exit a position as part of his/her strategy.
Day traders believe they can enter a market and ride the momentum as it continues to rise or enter a declining market and profit from its downward movement.
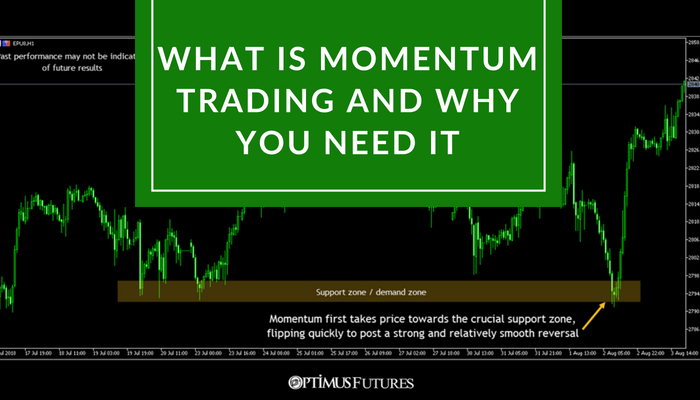
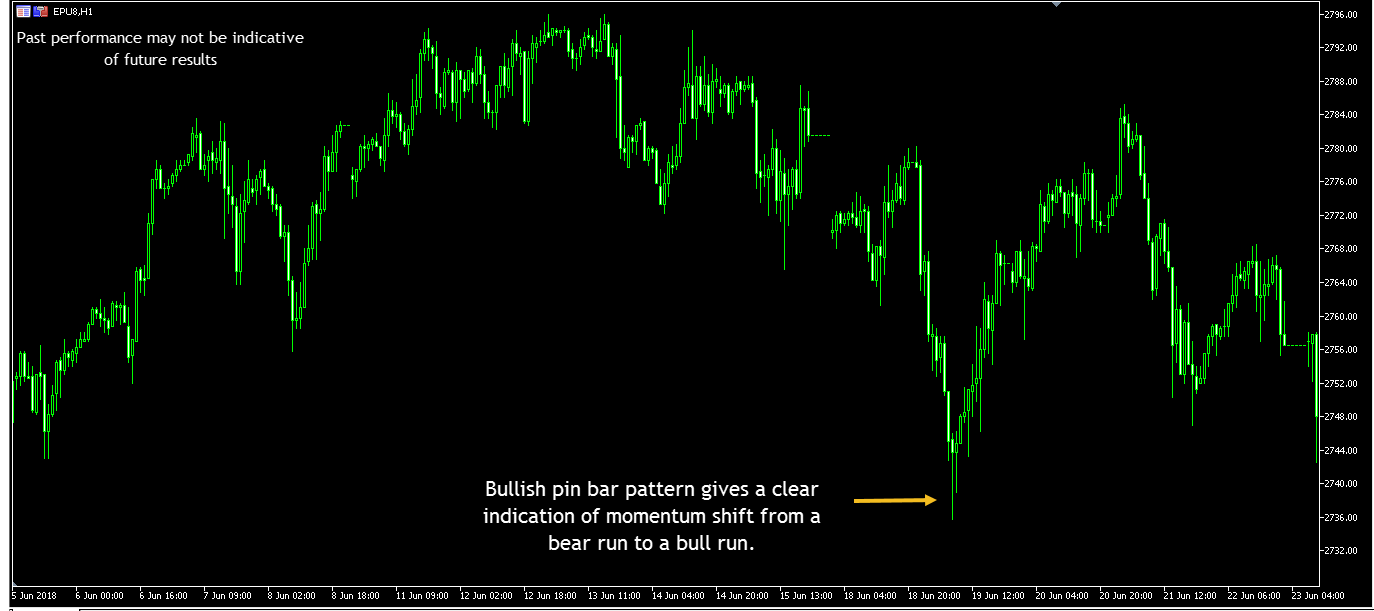
Either trader believes that the trend will continue in the same direction. Example of how momentum trading work is below:
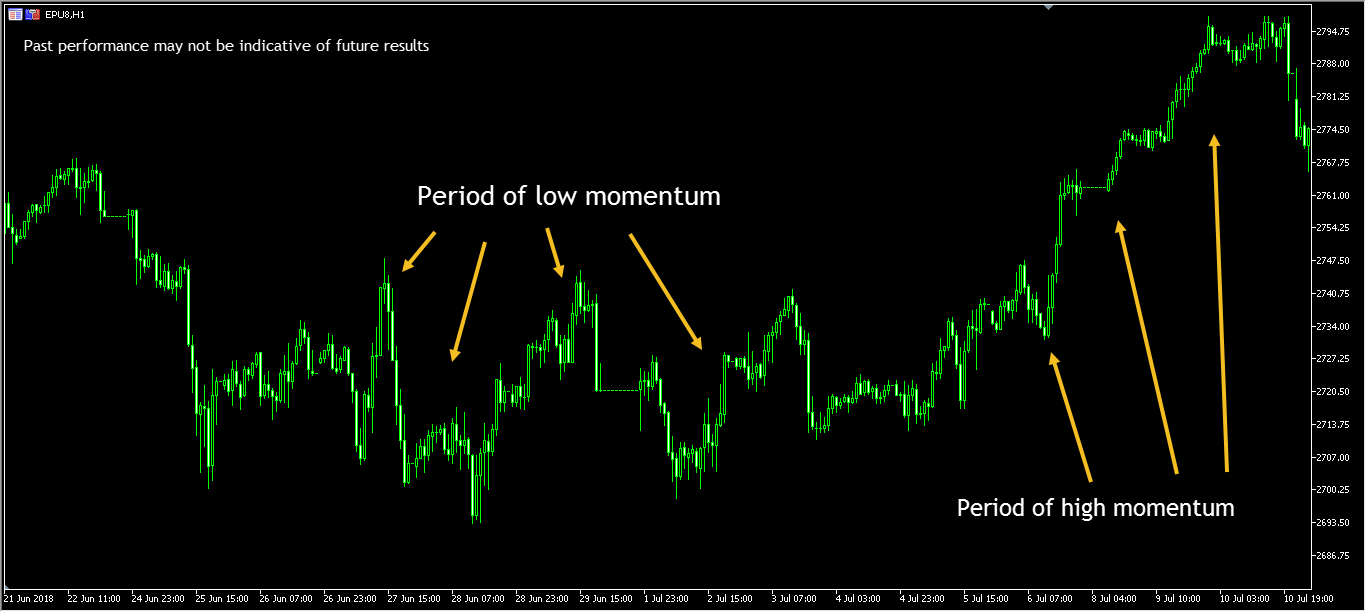
The chart above compares a period of a choppy market with no momentum versus a period of high trading momentum. Again, you should note how the market trend strongly towards the upside in the “high momentum” phase. Typically, the volume in trending markets will rise as participants add positions.
Momentum traders should also consider the time frame they are looking at. While a day trading chart may show strong momentum, a longer-term chart could show a lackluster period.
The opposite could occur as well. A simple example to demonstrate this would be to assume a market that could be heavily up-trending on the daily time frame but has been trading sporadically in a sideways pattern on the five-minute time frame.
Under most circumstances, the short periods of dull trading activity on the five-minute chart might not reflect in large-sized daily candlesticks that encompass a full day of trading activity.
In this case, while an intra-day momentum trader might prefer to wait on the sidelines for a more predictive market rhythm, the daily time frame momentum trader could reasonably be actively looking for potential trading opportunities.
What Factors Affect Momentum Traders?
Three main factors drive price momentum:
- Trade Volume: the more participants are in a trend, the more solid the move. For example, you can see that higher price trends also are associated with higher volumes. Conversely, if the movements are associated with lower volumes, they are most likely to correct fast.
- Price Swings: The pace of price movements dictated the market’s volatility, and wide price swings are sought by day traders seeking to make quick profits. However, this is also a double edge sword where “unhealthy” volatility is so broad it moves instantly against the trader.
- Time Horizons: momentum can occur, as we will mention, over different time frames. There are various risks and rewards associated with each time frame. Those who seek short-term momentum trades are willing to risk a little to gain a little. Swing traders are willing to risk more for a significant chunk of the move.
Can Beginner Traders use Momentum Trading Strategies?
Any investment advice you receive must be evaluated objectively against your trading skills. Investment objectives must take into account your risk tolerance and appetite. In momentum trading, you will observe buy and sell signals of technical indicators and chart patterns. Learning how to apply such methods in real-time trading will take some time.
Yet, momentum concepts and applications could be easier than learning how to apply macroeconomic news, especially when we are overwhelmed today with news announcements, social media, and personal opinions.
Also, following the underlying news of any given asset class may prove to be very challenging.
Momentum trading allows a trader to focus on several indicators, price action, and chart patterns. While we do not want to downplay the challenges this entails, it is still a skill that could be acquired through practice and observing market behavior.
How To Trade Momentum Trading Strategies?
To exploit momentum strategies is a matter of identifying price action direction very early. Momentum traders should begin by identifying sequences of higher highs and lower lows as a starting point.
Choose the time frame for your momentum trading strategy. For example, if you are a day trading scalper, you should focus on short-term trades using a 5-minute to a 30 min chart. If, on the other hand, you seek to be a momentum swing trader, then you should strive to look at daily and weekly charts.
Momentum trading attempts to provide the trader with the ability to scalp positions in a particular market direction while your trading outlook may be longer. For example, you could belong to a group of momentum traders seeking additional income while holding on to your longer-term position.
For example, you may have a bullish outlook on the Emini S&P Futures market. You can scalp the market every time the market dips by buying and selling. That momentum trading allows you to hold on to your longer-term position.
Regardless of your approach to momentum trading, keep in mind that it comes with risks and your market awareness has to be above average.
Most momentum traders have to act quickly to take advantage of the positive momentum that the market provides. Does momentum trading works? Not for everyone.
if you start momentum trading, you must be aware of when to avoid it and make sure you exit as fast as you can if momentum dries up ( this means you may be at a loss). Pay attention to 0rice action principles like support and resistance trading, order flow, breakout scenarios, and situations relating to fake breakouts.
Advantages of Momentum Strategies For Beginner Traders
Technical Simplicity: A beginner futures trader can employ momentum trading strategies because it does not require a deep understanding of fundamentals or some macro analysis that sometimes could be highly biased.
Short Term in Nature: It provides, at times, quick trading where you do not need or require to hold the underlying asset for prolonged periods.
Confirmation Tool: Those engaged in momentum investing could also initiate their trade based on some momentum indicators and hold the asset for more extended periods. Momentum trades could serve as your first due diligence sign to see if you wish to engage in a long-term trade.
Multiasset Indicator: Momentum trades could be traded across multiple assets, stock trading, Futures, Spot FX, ETFs, etc. Always make sure that the market you trade in is liquid.
Long and Short Strategies: Momentum trading strategies could be traded to the upside and the downside. Futures traders frequently do that over asset classes such as index futures (like stock trading, but you trade the total index).
Different timeframes: It could be used for day trading and Swing trading. For example, you may have a 5-minute or 4-day outlook; either way, momentum trading could occur over a short and long period depending on the chart’s time frame and momentum indicator type.
Risk Management: Day traders use momentum trading strategies for risk management purposes. For example, it could limit their exposure or be used as a stop-loss in some instances.
It is important to emphasize this because some may consider momentum trading only for entries but use their intuition for exits, which in our opinion, does not work out in the long run and would result in many instances of a losing trade.
How to Practice Momentum Trading Strategies
If you want to start trading momentum strategy using the futures markets, please use the following steps below.
- Choose the suitable Futures contract (you can choose financial instruments such as Micro E-minis stock market indices, Crude Oil, Gold, currency pairs, etc.)
- Choose a trading platform like Optimus Flow with a built-in technical momentum indicator.
- Practice on a demo account with live price data. Look for price action with downward trends and volatile markets and observe how the market and the other market participants behave in the financial market. The key is to observe a particular price move and develop a strategy around it.
- If you feel you have achieved sufficient proficiency, you can proceed to open an account with a Futures Broker
Past performance is not indicative of future results.
Disadvantages and Risks of Momentum Strategies
Price Target Specific: Trading strategies that rely on momentum are very short in focus. For example, proper position trading would require the trade to have particular entry and exit points with a small margin of error at times.
Costs: Short-term momentum trading could cost the trader additional commissions because the trader requires to enter in and out several times a day or a week.
Abrupt Changes: A momentum strategy is subject to the immediate risk of a trend reversal, which entails the trader developing a rapid exit strategy associated with the trade.
Short-Term Focus: Psychologically, the short-term focus is one of the risks involved in technical analysis using momentum. This is both strategic and psychological. You must pay attention to higher prices, fast bearish trends, and spot emerging trends.
While the fundamental analysis may allow you to overlook certain price moves and have a longer-term focus, technical analysis does not.
Asset Migration: Traders rely purely on market volatility to spot opportunities, so you may need to jump from one asset class to another
Bullish Bias: Momentum trading strategies could be applied to long and short strategies, but they have a bullish bias. Traders tend to buy assets that are trending upwards. Momentum with downward tendencies is challenging for traders as they sometimes try to pick bottoms.
What Trading Indicators Should Momentum Traders Use
You probably ask yourself at this point what momentum indicators you could use in your strategy.
Here is a list of what we consider the top ten indicators, but please don’t think that in any analysis of the financial markets, you should not use all. This will lead to indecision and often more confusion than clarity.
While some of the indicators may be basic, some are more specialized. We have identified below which indicators are lagging indicators and which are leading indicators.
Your decision to enter should be discretionary and have risk management associated with it.
Now let’s cover what some traders use as a leading indicator and what some use as a lagging indicator for momentum trading strategies. You can choose what momentum indicators you wish to use based on your trading experience and level of understanding in interpreting the indicator.
You can go with what you feel comfortable reading and interpreting as far as price movements.
Lagging Momentum Indicators
- Moving Average Convergence Divergence This indicator uses moving averages to measure the strength of a trend and identify momentum changes.
- Moving Averages attempts to smooth our price trends data and identify momentum.
- RSI (Relative Strength Index) Plots the trend’s momentum and strength by crossing the zero line. In addition, it travels to the upside (positive momentum) or the downside (negative momentum).
- Stochastic Oscillator This indicator compares the price change of an asset to its price range over time and attempts to identify overbought and oversold price levels.
- Bollinger Bands(TM) An indicator created by Mr. John Bollinger. Its plots areas of Standard Deviation around the price bands.
- ADX (Average Directional Index) measures a trend’s strength and identifies momentum.
Leading Momentum Indicators
- Commodity Channel Index(CCI) Helps identify over-bought and over-sold conditions by measuring the asset’s deviation from its mean.
- Aroon Uses trend and momentum to identify to determine the likelihood of a price trend continuing.
- Chalking Money Flow Measures prices and volume to estimate the money flow into any asset in the financial market.
- MFI (Money Flow Index) Measures buying and selling pressure through price and volume.
What Chart Patterns are Associated with Momentum Price Action?
- Breakout Patterns When the price of an asset breaks above or below a key resistance or support level, a breakout pattern can form. Such patterns indicate that the momentum has shifted, and a new trend may begin.
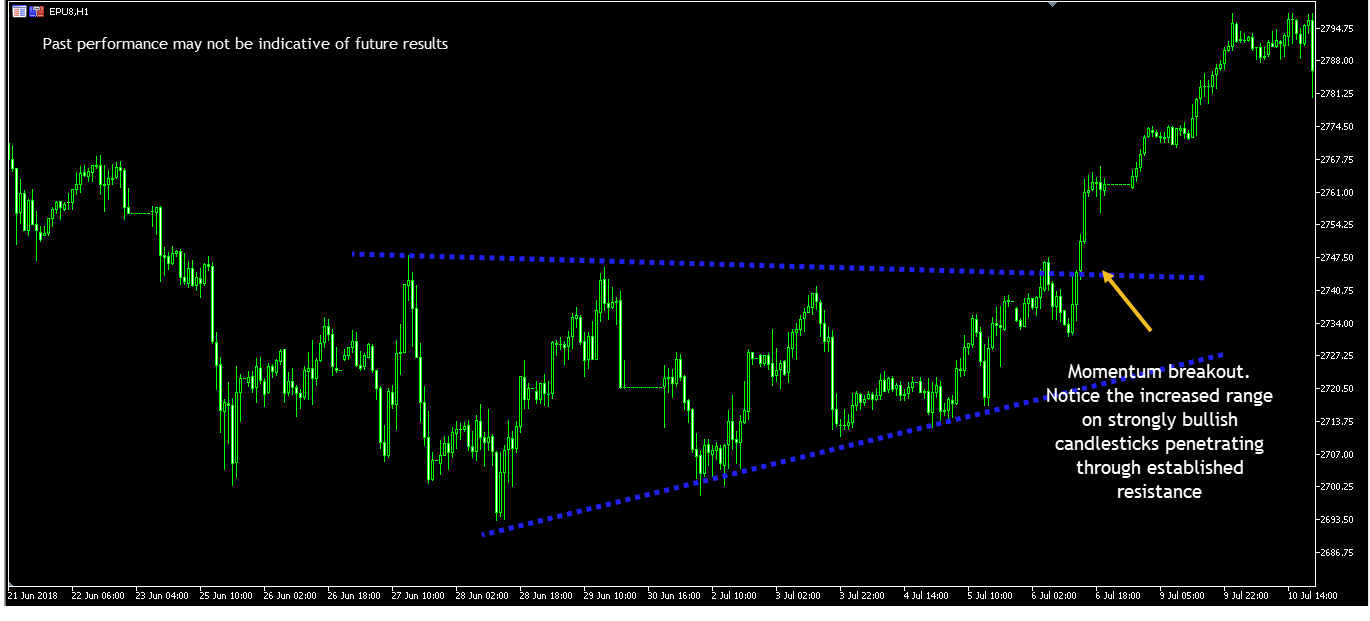
- Flag and Pennant patterns are characterized by a period of consolidation and then a breakout in the same direction as the prevailing trend.
- Trendline Patterns Trend lines connect highs and lows to indicate the direction and strength of a trend. A breakout from above or below a trendline can signal a change in momentum.
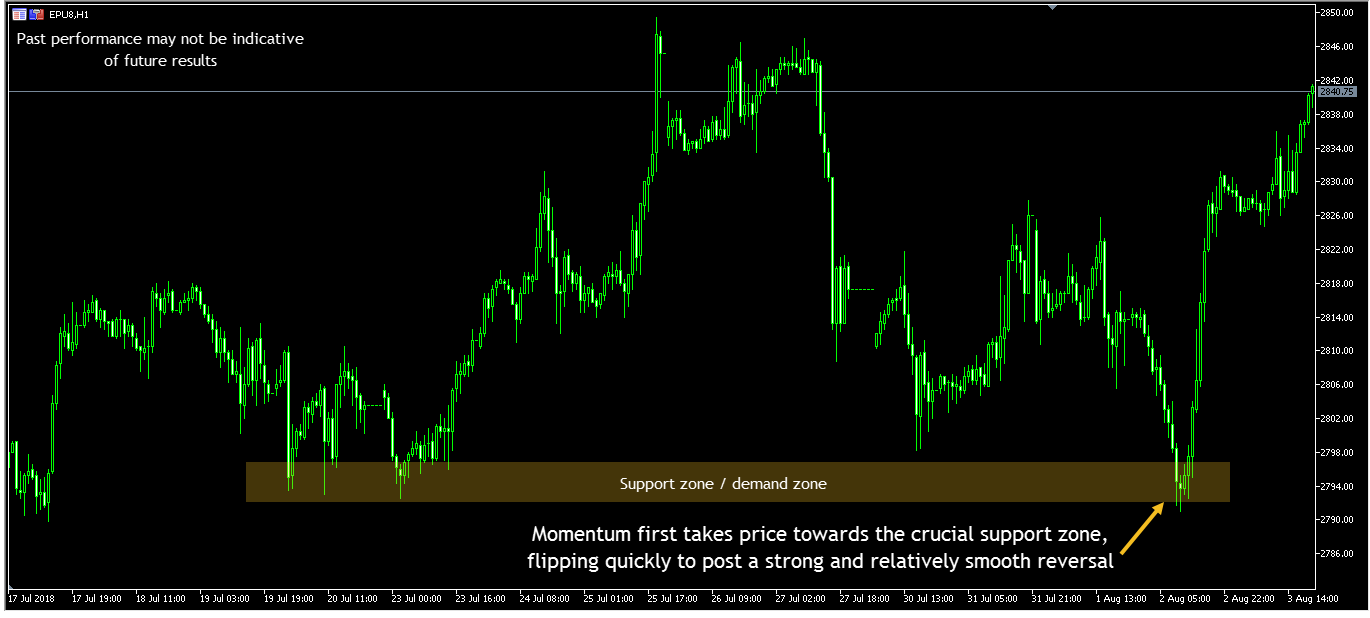
- Double Tops and Bottoms occur when a security’s price reaches a support or resistance level, fails to break through that price, and then returns to its previous range.
- Head and Shoulders The pattern looks like a baseline with three peaks. The two outside peaks are close in height, and the middle peak is the highest.
- Reverse Head and Shoulders The head dips lower than the other two points, giving it an inverted head-and-shoulders formation.
- Cup and Handle a shape of a cup followed by a handle.
- Wedges: Converging trend lines
- Gap Patterns are created when the price of an asset moves up or down quickly and leaves a gap in the chart. This means that the prices do not follow a smooth sequential direction.
- Triangle Patterns pattern of converging trend lines.
In Conclusion
Momentum trading involves buying assets with strong price momentum and shorting or selling assets with weak momentum. This strategy may be applied to a wide range of assets (currency pairs, stocks, futures, etc.) and is used by both beginner and advanced traders.
Whether the financial markets are in a bearish or bullish trend, momentum could assist with entry orders and exit strategies.
Still, all trading carries risk, so it’s important to consider the potential rewards and risks before committing capital. It’s also worth noting that experience can be an asset for traders in some cases, as it can help them better understand the markets while developing their strategies over time.
There is a substantial risk of loss in futures trading. Past performance is not indicative of future results.