This article on Combining Technical Analysis with Order Flow is the opinion of Optimus Futures, LLC.
Technical Analysis primarily analyzes historical price data, chart patterns, and various technical indicators to forecast future price movements. It examines market behavior, trends, and patterns to identify potential trading opportunities.
Order Flow Analysis is focused on analyzing the actual buying and selling orders in the market in real-time, aiming to understand the dynamics of supply and demand as well as the intentions of market participants.
By combining tradition technical analysis with order flow, you can enhance the transparency of your trading strategy and hypotheses with ease. Utilize simple techniques to merge the two methods and experience the benefits of a more refined trading approach.
The Limitations of Technical Analysis
The indicators we use for Technical Analysis are well-known and abundant.
- Moving Averages
- RSI
- Bollinger Bands
- Stochastic Indicator
And so many more. Developing a trading strategy based on these can be relatively easy. Taking an approach of – If this then this, then executing a trade based on those parameters, becomes just an exercise of creativity and logic.
However, there are common drawbacks to trading solely with indicators.
- Indicators are based on historical price data, which means they are inherently lagging in nature. The signals provided by indicators are based on past price movements, and by the time a signal is generated, a significant portion of the price move may have already occurred. Think about breakouts that are valid, by the time there is a crossover or signal, price may have already moved significantly past the optimal entry.
- Since indicators are solely based on mathematical calculations and patterns, they lack context. A breakout to new highs could be confirmed with an indicator giving a buy signal, however, price may be gravitating toward a liquidity pool of a recent high to make a move lower. Indicators simply cannot digest all the market narratives that are possible.
Indicators give us an idea of what has happened, yet our mind tries to associate past experiences with future ones, creating a bias that may not be a true reflection of what’s happening in the moment.
How Order Flow Analysis can Help Technical Analysis
The methodology behind order flow is that it involves monitoring and interpreting the incoming orders, order book depth, time and sales data, and volume profile.
It looks for patterns and imbalances in the order flow that can provide insights into market sentiment and potential price movements.
ALSO READ | How to Identify Imbalance in the Markets with Order Flow Trading
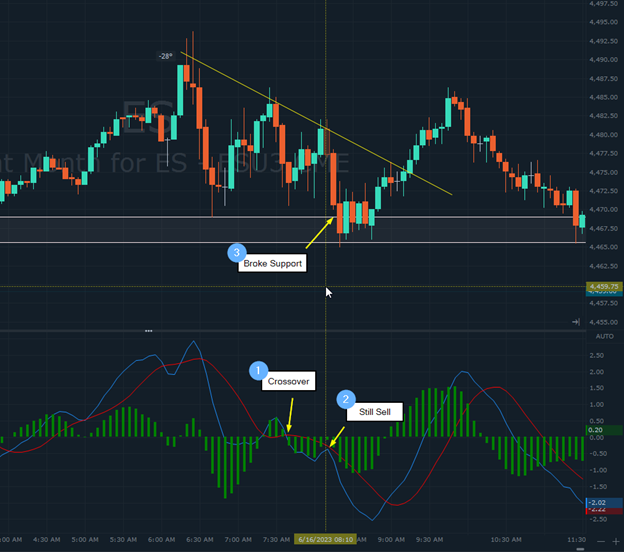
Let’s take a look at an example from 6/16/23. The MACD crossed over at point #1, was still in a sell signal at point #2, and price broke support looking like it may keep going.
The MACD was still a strong sell.
To incorporate Order Flow and build context into the market, we have to have a thesis. If we shorted this with the expectation that it could go lower, what would we want price action to look like?
If people were fearful that price would move lower, how would the market behave?
We would see bids moving off prices as price came down, skeptical that price will keep going.
There would be an accelerating negative delta, signifying more market sellers than buyers.
Conversely, if it was a false breakout, how would the market behave? We would see bids remaining in place, bids reloading indicating algorithms, and iceberg orders.
There would be market selling, yes, but it would not be increasing. There would gradually be less and less marketing selling as it dies off.
So now we have two narratives within this sell signal from the MACD (assuming that was the only parameter that triggered the trade, I’m just using this as a basic example).
We have identified what they could be:
- A valid breakout to the downside
- A liquidity pool loading up longs to take it higher
We have also identified what those scenarios might look like in terms of order flow. Think of the old pits and open outcry, when prices were fought after it would be louder, there would be more movement, faster movements, etc.
It’s the same in the Depth of Market and Footprint, you see their, well, Footprints.
Now let’s take a look at a Footprint chart on this particular sell-off.

The first time price went below the support area, it was held up by big bids absorbing the market selling. This is shown in #1 and #2.
We mentioned earlier, if this was a valid selloff then we would want to see bids moving away from price as it sold to signify reluctance from buyers, the opposite happened. Buyers in the form of limit orders stepped in and held their bids to get long.
The other indicator here is the negative delta drying up rather quickly. It went from negative 1200, then negative 700, to about even then market buying.
Again, not something we would want to see if the move was likely to continue down.
We can also see volume decreasing as this played out with the time histogram. When price came back down it was again held up by strong bidding while it absorbed any remaining market selling.
Too many indicators can certainly add confusion to any strategy, but using a select few in conjunction with order flow can help to drastically improve our ability to decipher market information and make better-informed decisions.
In this particular example, if we were short going into the break below, the glaring decision would be whether or not we exit the trade based on order flow not lining up with our thesis.
This can be a difficult decision to make especially if we are in profit and expecting a move lower.
But the order flow clearly showed that the probability of the move continuing was low.
Combining Technical Analysis with Order Flow
This was a great example of how an indicator does not provide the full scope of the market narrative. We also saw how we can use order flow to further validate a trade idea or negate our thesis in real-time.
I don’t think a trading strategy should include just one indicator, but it’s also easy to become overwhelmed with too many indicators and parameters.
Whatever your trading strategy is, implementing order flow to confirm or negate your thesis can be extremely helpful and easy to do within Optimus Flow.
Trade Order Flow Imbalances with our FREE trading platform – Optimus Flow
Want to learn order flow? Ask questions here on our community site.
There is a substantial risk of loss in futures trading. Past performance is not indicative of future results.