This article on Footprint Charts is the opinion of Optimus Futures.

Understanding what drives price changes in the market is essential for traders. Traditional charts, such as candlestick and line charts, display price fluctuations.
However, they fall short in providing insights into the specific transactions at each price level. This is where footprint charts come in handy.
Footprint charts, also known as cluster charts, provide a deeper look into the buying and selling activity within a specific timeframe.
They show the volume of trades at each price level, giving traders more insights into market behavior.
In this guide, we’ll explain what footprint charts are, how to read them, and how you can use them to improve your trading strategies.
We’ll also discuss different types of footprint charts and offer practical tips to help you get started.
Key Points:
- Footprint or ‘Cluster’ Charts analyze transactional volume inside a given timeframe.
- This analysis looks at the interaction between buyers and sellers to uncover opportunities.
- Footprint charts come in several flavors including bid/ask, volume profile, and delta.
- Strategies for trading with footprint charts include stacked imbalances, unfinished auctions, and high-volume nodes.
- Traders can open a free account for 30 days and immediately access Optimus Flow’s numerous footprint charts and analysis tools along with unlimited simulated trades.
What Moves Price Up and Down?
That simple question underpins footprint charts. Most traders and investors are familiar with candlestick and line charts.
These visual representations show us price movement over time and may include volume. But they fall short when trying to tell the entire story, like a book missing its adjectives. That’s where footprint charts come in.
What Are Footprint Charts?
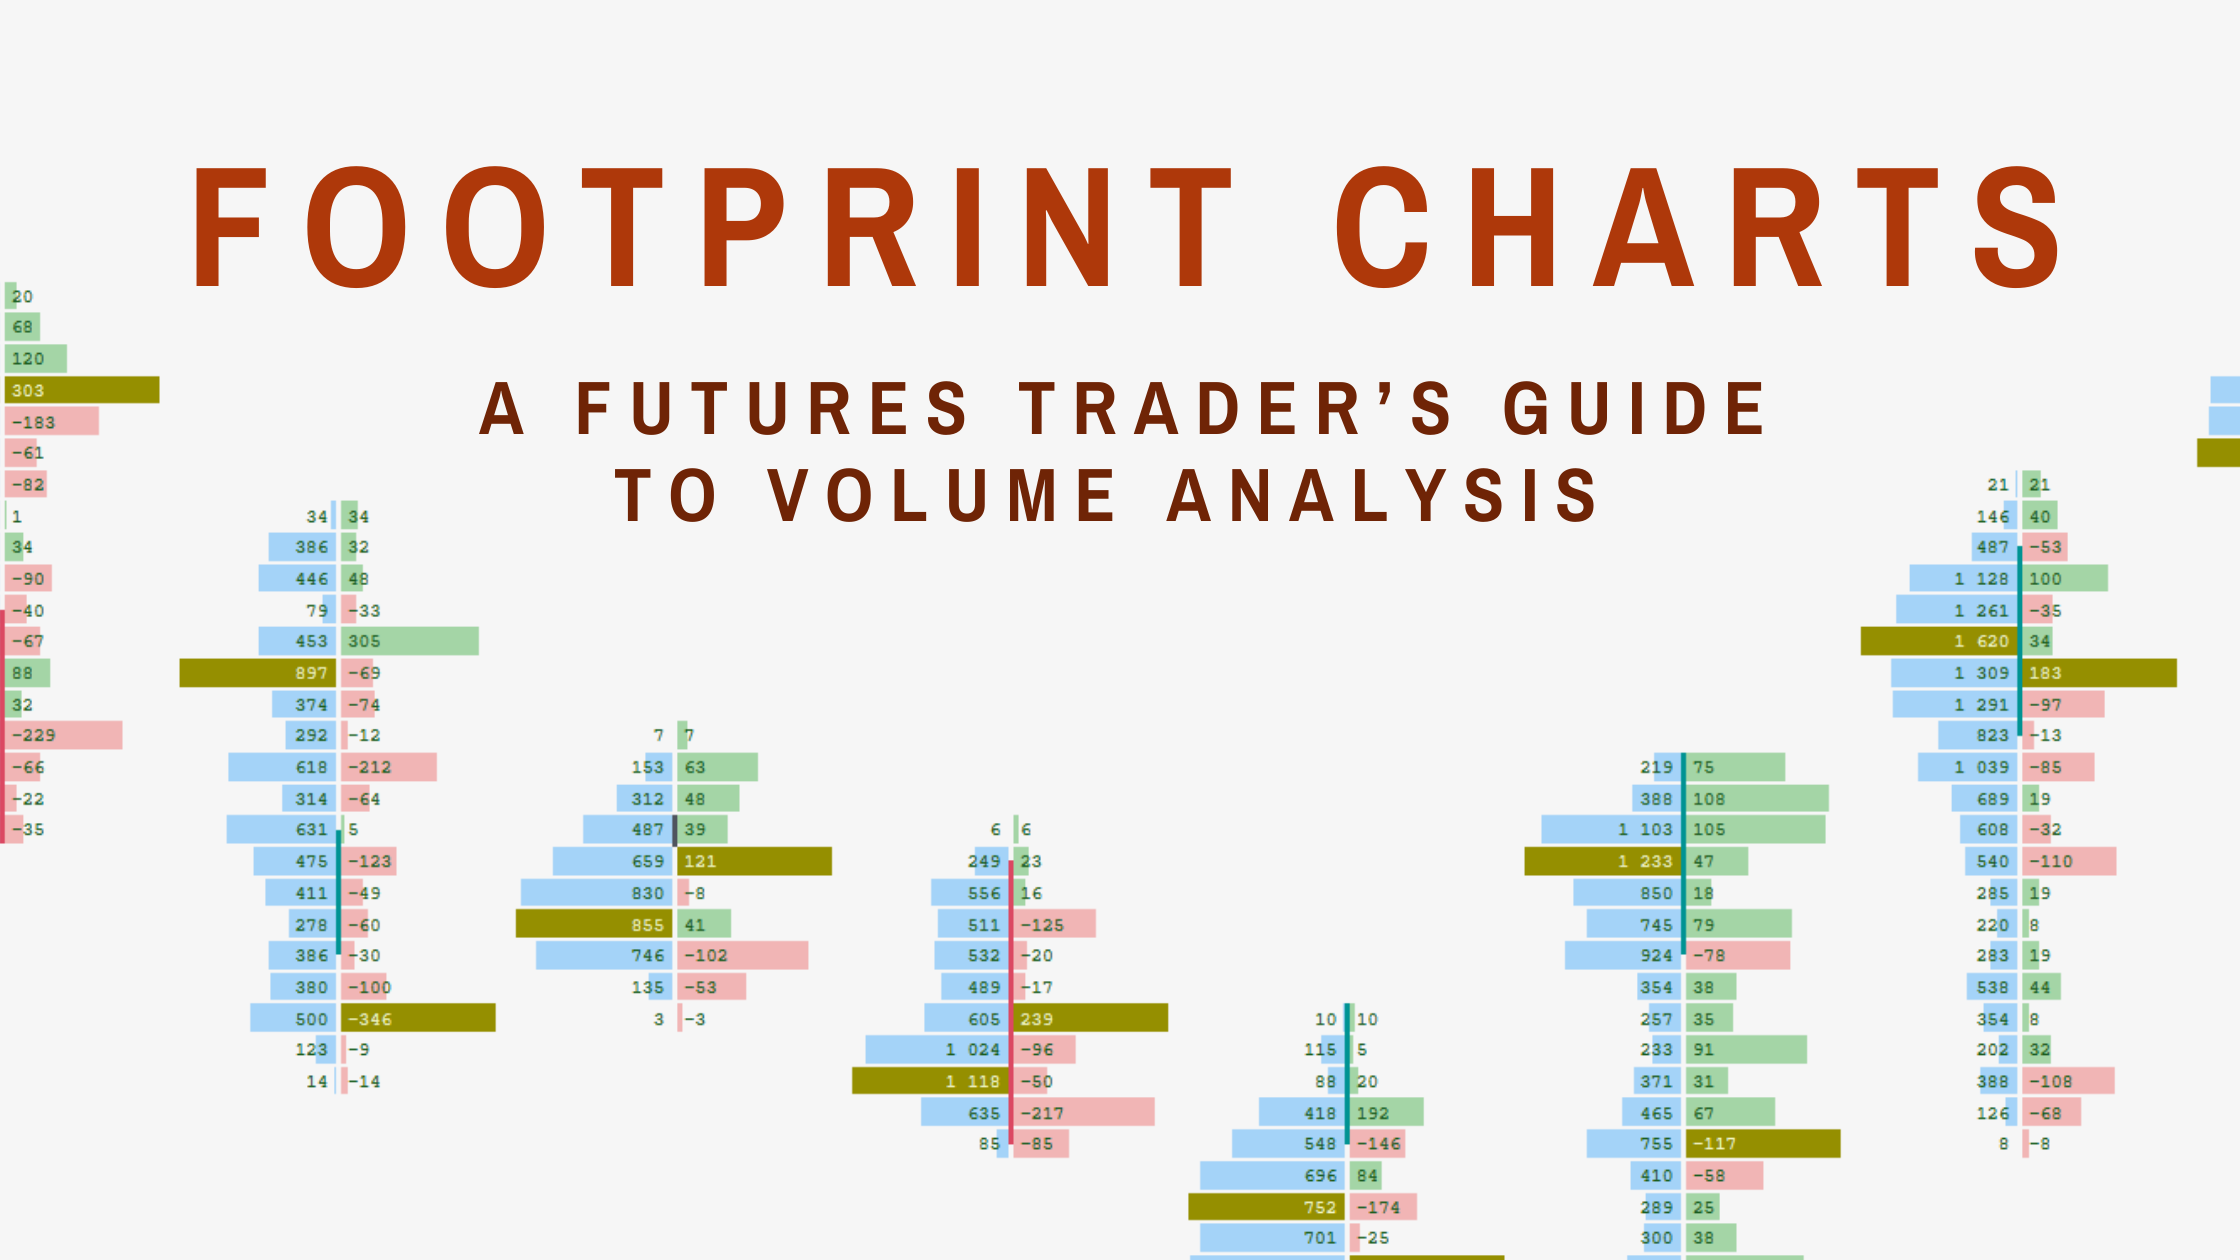
A footprint chart is a multi-dimensional type of candlestick chart that shows traders the volume traded at a precise price level with that candlestick.
Think of it as a candlestick with notes that describe how the transactions occurred within that bar.
The footprint chart was initially created by the now-defunct company MarketDelta as a trademarked product in 2003.
Due to the trademark, different trading platforms have adopted alternate names for footprint charts. Some synonymous terms for footprint charts include cluster charts, bid/ask profiles, and numbered bars.
How to Read Footprint Charts
Before we jump into trading strategies utilizing footprint charts, let’s discuss how to read a footprint chart.
Take a moment to examine the side-by-side image below of a traditional candlestick chart (left) vs. a bid/ask cluster chart (right).

Image 1. Footprint Chart vs. Candlestick Chart Comparison: A side-by-side comparison of a traditional candlestick chart and a bid/ask cluster chart.
Footprint Charts vs Candlestick
On the left side of the cluster chart are the sellers who were hitting the bid (sold). Meanwhile, the numbers on the right-hand side of the cluster chart show the buyers who lifted the order (bought).
To use the 749 x 864 cluster as an example, at that corresponding price there were 749 lots to hit the bid (sold) and 864 lots that lifted the offer (bought).
Cluster charts allow investors to examine the executed orders within a candlestick chart and analyze the interaction between buyers and sellers.
Footprint Charts vs Candlesticks vs Depth of Market
As previously discussed, a footprint chart is a multidimensional type of candlestick chart which shows trading volume at precise price points over a given period. A standard candlestick displays the open, high, low, and closing price without the intrabar transaction information.

Depth of Market (DOM):
DOM is a measurement of the supply and demand for a liquid, tradeable asset. Also known as the order book, DOM shows you how many open orders and relevant quantities exist at each price.
In the screenshot below from Optimus Flow, you can see the different amounts open for the bid and ask across different price points in the E-Micro S&P 500 Futures.

Image 3. Depth of Market (DOM) Example: Screenshot from Optimus Flow showing bid and ask quantities across different price points.
Best Footprint Charts
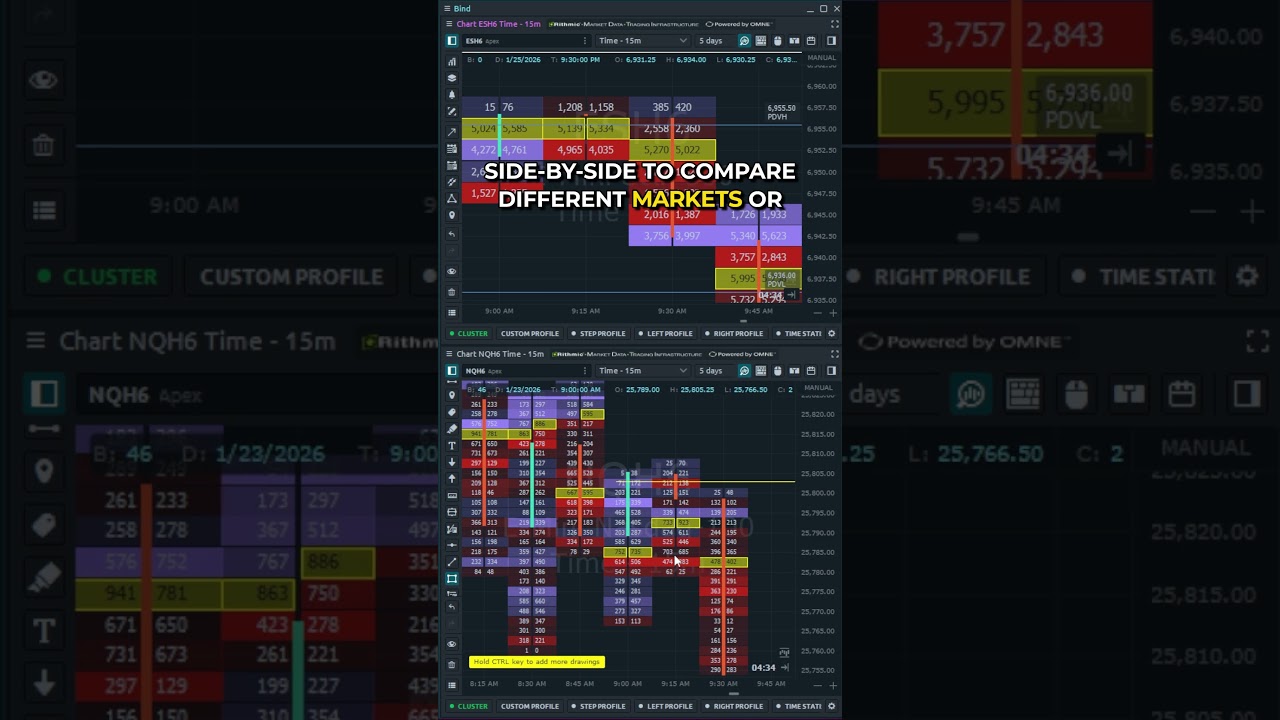
The three most common types of footprint charts are bid/ask, volume, and delta.
- Bid/Ask Footprint: This is the most common type of footprint chart. The Bid/Ask Footprint displays the number of contracts traded on the bid and ask price for a given period.
- Volume Profile: The volume footprint shows the total number of contracts traded at each price without regard for if the trade was a bid or ask. This can be valuable for showing price levels where there is interest from both buyers and sellers.
- Delta Footprint: While using delta within order flow trading can be complex, the concept of the delta is straightforward. At its core, delta represents the difference between completed orders at the bid and offer for a particular price.
Using the image below as an example:

Image 4. Delta Footprint Example: An example of a delta footprint chart showing volume differences at various price points.
- The first delta is 826. This means that 1,514 buyers lifted the offer against 688 sellers hitting the bid.
- Next, we have a delta of -436. This means that 1,956 buyers lifted the offer against 2,392 sellers who hit the bid.
- Following that is a delta of -75, meaning that 2,402 buyers lifted the offer against 2,477 sellers who hit the bid.
Knowing the volume differences initiated by buyers and sellers at differing price points can help a trader determine which party is being more aggressive. This information might in turn confirm a trader’s suspicions about an emerging price trend.
Note: Volume at the bid indicates sellers. Volume at the ask indicates buyers.
How to Analyze Order Flow Using Footprint Charts
Footprint charts expand on the volume and transactions within a timeframe to create context. Our analysis should seek to understand this additional information.
Key Analysis Points:
Imbalances: Lopsided amounts of buying or selling
Order blocks: Large amounts of contractual volume occurring
High volume nodes: Areas where heavy amounts of volume collect
Each of these identifies an area of support/resistance or a point that precedes an expansion in price.
For example, when we can assume that a spot where heavy amounts of buyers stepped in would also find buyers, all things are equal.
Why?
Because those same buyers could have sold into higher prices and now want to reload back at that same spot.
Similarly, you might find a block of sell orders coming through one candle after another. That could be a clue to future price movement.
The key with any analysis is using context, or looking at the bigger picture, to frame the trade.
Pro Tip: If you overlay a footprint chart on a bar or candlestick chart, ensure the aggregation time frames align. Put simply, if you analyze 30-minute candlesticks, the footprint analysis should also work off 30-minute blocks.
ALSO READ | Best Order Flow Indicators to Spot Buying and Selling Pressure
Footprint Trading Strategies
If you’re new to footprint trading, don’t worry.
We want to give you some trading ideas to help you get started.
Stacked Imbalances
With bid/ask profiles, we see how many contracts trade at the bid and ask.
When we see a lopsided amount stacked vertically in a price range, it can indicate a support or resistance level.
For example, in the chart below, we highlighted an area where several sets of buy orders outweighed sell orders. The Delta footprint chart gives us the clearest picture here.

Image 5. Stacked Imbalances Footprint Strategy: Highlighted areas of buy orders outweighing sell orders in a delta footprint chart.
Traders can use these imbalances to look for reversals or slow the momentum of a strong price movement.
Learn More about How to Identify Imbalance in the Markets with Order Flow Trading
Unfinished Auctions
Unfinished auctions are a unique trade idea specific to footprint trading.
The idea is that each price sees an auction between buyers and sellers within a candlestick/bar.
When a certain price, usually an extreme on the candlestick wick, sees buyers or sellers only, it’s seen as an unfinished auction.
For example, in the chart below, you’ll see areas highlighted where we find zero bids or asks at highs and lows.

Image 6. Unfinished Auctions Footprint Strategy: Highlighted areas with zero bids or asks at highs and lows in a footprint chart.
Volume Profile
So far, we’ve discussed different ways to analyze the intrabar volume. Our last strategy looks for areas of high volume as points of support and resistance.
High volume areas can act as support, resistance, and even attraction nodes to the current price.
In the chart below we noted the price with the highest volume for that given period. Later on, you can see how price found resistance and support, albeit temporarily, at those levels.
A trader could use those prices for a scalp trade in the opposite direction or a swing trade towards those areas of liquidity.

Image 7. Volume Profile Footprint Strategy: Chart showing high volume areas acting as support and resistance points.
How To Start Trading Futures With Footprint Charts
If you’ve never tried them before, you should at least take a test-drive of footprint charts.
Optimus Futures lets you sign up for a free account for 30 days and take unlimited simulated trades.
Here’s a quick step-by-step guide to trading futures using Optimus Futures flagship platform Optimus Flow.
- Open up a TPO chart – At the top left of the Optimus Flow platform, you’ll find several icons tied to the different tools. Select the light blue ‘TPO’ icon. This will open a cluster chart.

- Analyze your data – You’ve now opened a fully customizable footprint chart.
- Set up your trade – The easiest way to trade directly from your chart is to enable order chart trading. You can also open the order entry menu. Both are available in the top right corner. You can also select the ‘OE’ icon shown above to open an order entry window.

- Place your order – Once you’re ready, place your order. Be sure to log your trade with any notes in Optimus Flow’s automated trade log
- Follow your trade – After you enter your position, use the ‘Positions’ window to monitor your trade (The POS icon).
Open Your Free Account
Footprint charts open up a whole new way to look at the market.
Open your free account today with Optimus Futures and get immediate access to our flagship platform, Optimus Flow.
For 30 days, you can explore every indicator, analytical style, and footprint chart Optimus Flow has to offer, along with a host of other functions and indicators.
Plus, you get unlimited simulated trades and access to the automated trade journal.
Trading futures and options involve a substantial risk of loss and are not suitable for all investors. Past performance is not necessarily indicative of future results.


