
Moving averages are among the most popular and widely used technical tools in trading. Here are 5 reasons why moving averages add a lot of value to your trading and help you make sense of your charts.
1: Direction of the trend and reading market sentiment
This is probably the most common use for moving averages. When the moving average is pointing up and price is above the moving average, it indicates an uptrend – and vice versa. Furthermore, moving averages can be used to gauge overall market sentiment. When the majority of stocks are trading above their moving average, it signals a healthy and bullish environment.
The 4 most commonly used moving averages are:
200 Period Moving Average | Very long term moving average and even the financial media and authoritative finance sites frequently talk about prices approaching the 200 period moving average.
100 Moving Average | Medium term moving average.
50 Moving Average | Medium or short term. Has gained popularity due to the use in the Golden Cross (read further) trading methodology.
20 Moving Average | Short term only. Very popular for day-traders to interpret and analyze daily price movements.
2: The slope of moving averages and trend strength
The slope of the moving average can tell a lot about the strength of a trend. Furthermore, a moving average that shifts from strongly pointing upwards during a bull trend, to going sideways can provide early warning signals about a shift in sentiment.
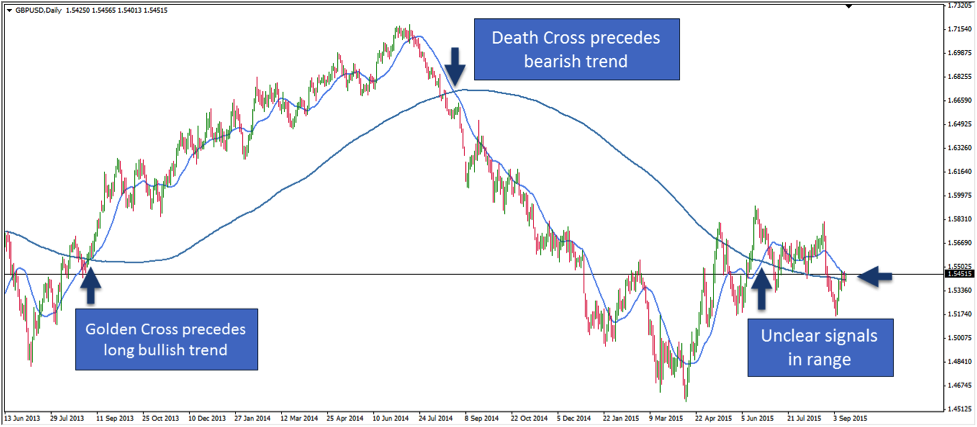
3: The Golden Cross trading methodology
Although the Golden Cross is somewhat controversially discussed, it is worth pointing out here. The Golden Cross describes a scenario where the shorter term 50 period moving average crosses over the 200 period moving average – typically on the daily chart.
Followers of the Golden Cross methodology believe that when a Golden Cross occurs, it signals the start of a long lasting bullish trend. On the other hand, a Death Cross exists when the 50 period moving average crosses below the 200 period moving average.
It is worth being aware of the Golden Cross because it appears frequently on finance media and many traders pay attention to it.
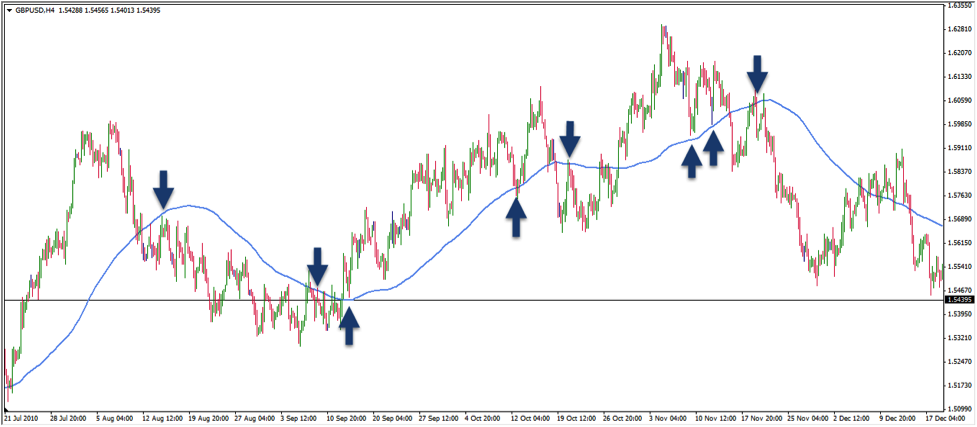
4: Moving averages as support and resistance
Moving averages often act of support and resistance. The 4 previously mentioned moving averages are so popular and widely used among traders is that price often respects them very accurately and it serves as a self-fulfilling prophecy. Therefore, you shouldn’t net get too creative with you choice of your moving average but stick to what the general crowd uses.
Moving averages also signal a trend shift. When the moving average does not hold anymore and price suddenly dips and closes below it, it often serves as a first warning signal that the trend could be changing.
Note, that during ranging markets, moving averages often lose their validity to act as support and resistance. Especially when you see a flat and sideways pointing moving average, it is usually advisable to stop using them as support and resistance tools.
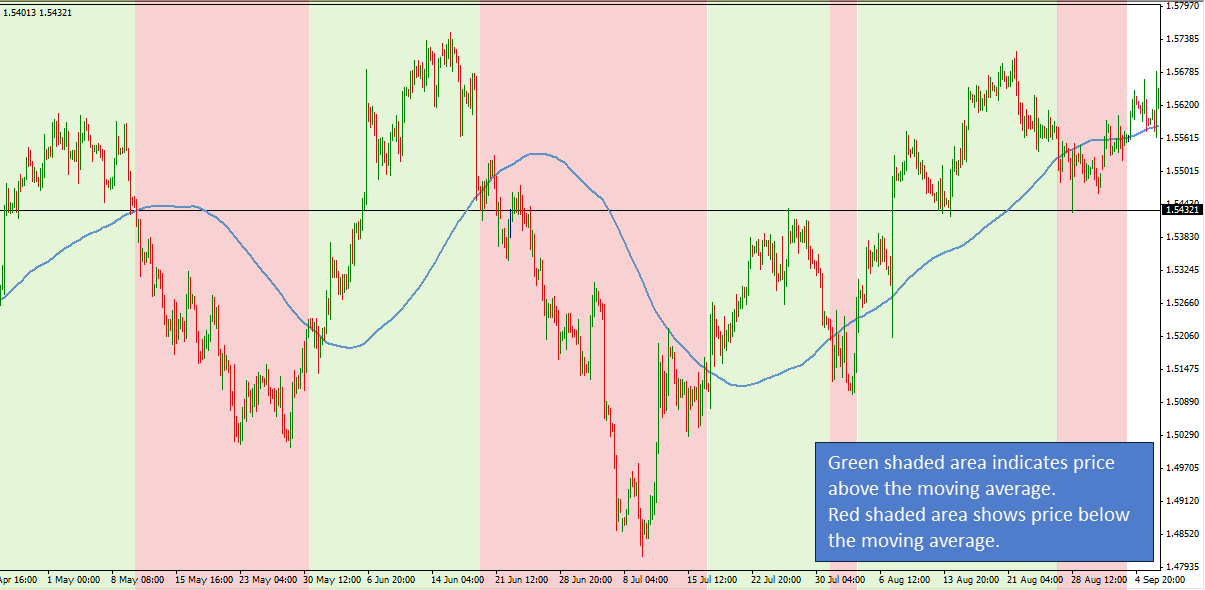
5: The Tiebraker
Moving averages are even used by the best traders. Marty Schwartz who has been interviewed on the Market Wizards book series named moving averages as one of his most important trading tools. He uses them as a filter to differentiate between bullish and bearish scenarios. Whenever price is above a moving average, he only kooks for long trades and when price dips below a moving average he only focuses on short trades.
The tiebraker method should be used following a top-down approach. For example, you can use the 200 or 100 period moving average on the daily time-frame to determine whether price is above or below the moving average and then go to the lower time-frames and only look for trades in that direction.
Wrapping it up: Moving averages as an all-round trading tool
While it usually isn’t enough to only rely on moving averages, they can be a great addition to your trading arsenal. Especially because they are used by so many traders, it is worth having them on your charts to know what other traders are looking at.
There is a substantial risk of loss in futures trading. Past performance is not indicative of future results.
