This article on MACD settings for Day Trading is the opinion of Optimus Futures, LLC and is not intended to be trading advice.

- The smaller the time frame, the more market noise factors into your trading environment.
- Since MACD can lag, as all moving average crossovers do, it might help to combine it with another indicator to confirm the probability of the price movement.
- VWAP and Super Trend indicators are two tools that can be effective in confirming bullish and bearish breakouts.
On the extreme short-term end of this style are the scalp type of trades. On the longer-term end, some trades can last for hours.
But usually, all positions are closed by the end of the day trading session to avoid overnight risk. Hence, the term “day trading.”
We’ve seen how the MACD can be used in longer-term position trading and short-term swing trading.
Next, we will explore a few strategies that adapt the MACD for the purposes of day trading.
Note that when trading ultra-short time frames, you are going to be dealing with more market noise than you would in larger time frames.
Your task as a trader is to exploit micro-movements of supply and demand.
These small price movements aren’t necessarily subject to fundamental drivers. With that said, it might help to combine your indicators to get a clearer read on these micro-movements.
MACD Settings for Day Trading | Volume Weighted Average Price (VWAP)
Here’s the trade setup:
- Price closing above the VWAP and at the same time MACD line crossing the signal line from below.
- Place a buy entry if the prices are very close to the VWAP, and avoid the buy signal if prices are too far from the VWAP. Make sure that there is enough time left in the day for the trade to develop.
- Place the initial stop loss at the nearest swing low, and trail the stop loss when there is a higher swing low.
- Place the target such that there is a minimum of 1:2 risk-to-reward ratio.
- If the trade is not stopped out, and the target is not achieved, then close out before the end of the day trading session.
- All the above conditions in reverse will be applicable for a sell entry.
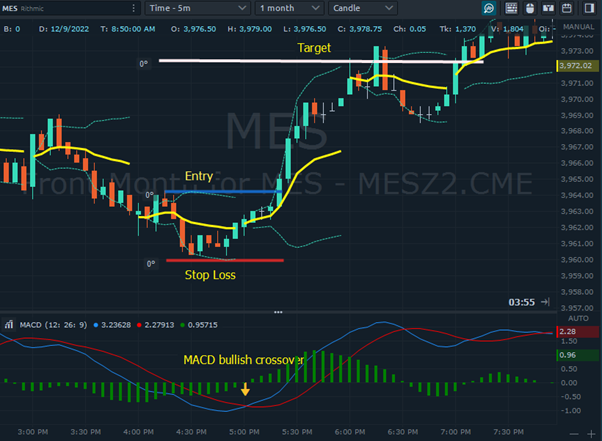
Figure 1.1 MES(Micro e-mini S&P 500 futures) 5-minute chart December 8, 2022, with VWAP yellow line in the top panel and MACD (12,26,9) in the bottom panel.
Note: Some Institutional traders may buy when prices are below the VWAP, which signals an undervalued condition.
But in the case above, the system is anticipating that prices may begin trending toward the overvalued levels.
This kind of approach won’t work for a mutual fund looking to enter large positions for the long haul. But it works for the day trader looking to scalp just a few points.
MACD Settings for Day Trading | Super Trend
Trade Setup
- Price closes below the super trend, and the super trend changes to red, and at the same time MACD line crosses the signal line from above.
- Place a sell entry if the above conditions are met. Make sure that there is enough time left in the day for the trade to develop.
- Place the stop loss just above the super trend and keep trailing the stop loss as per the super trend.
- Place the target such that there is a minimum of 1:2 risk-to-reward ratio.
- f the trade is not stopped out, and the target is not achieved, then close out before the end of the day trading session.
- All the above conditions in reverse will be applicable for a buy entry.

Figure 1.2 YM 5-minute chart December 6, 2022 with Super trend (10,3) in the top panel along with prices and MACD (12,26,9) in the bottom panel.
The Bottom Line
By no means should the sample strategies presented above be taken as an absolute recommendation.
They are simply basic examples of how the MACD can be used with other technical indicators to one’s advantage. A trader should always test the strategy himself before putting it to use.
There is a substantial risk of loss in futures trading. Past performance is not indicative of future results. Charting presentations and scenarios are presented as examples only and were prepared with the benefit of hindsight.