This article on Trading Biases is the opinion of Optimus Futures.

Trading long or short at the desired price level is often a matter of instant execution for the average retail trader who doesn’t have access to millions in trading volume. But did you ever stop to think that every time you want to go long because the points on the chart heavily favor a long bias, someone has to be selling to allow you to enter the market? The same would be true in the opposite scenario of a really obvious short opportunity. A short that you place in the market at current or pending price level will need to be met with a buyer at that same price.
In this article we explore why technical traders looking at the same chart can have opposite biases, and what exactly does this imply to your success in this business.
Why Traders can have Opposing Trading Biases for the Same Market
Following price action, using technical indicators, and looking for candlestick and chart patterns appear to be universal constants in the art of technical trading. It is often confusing for newer traders to understand why two technical traders looking at the same chart can have wildly opposite biases.
One explanation can be drawn from the extent of the usage of the tools mentioned above. While certain indicators, methods and market dynamics seem to be very popular among technical traders, the extent to which these traders employ these methods and the variations in the individual trading systems and methods can result in vastly different viewpoints and analysis of any given market condition.
For example, some traders prefer to follow indicators as primary market entry and exit triggers, and use price/market action as only a secondary trigger. Other traders who may be using price action as a primary trigger, may get excited about a candlestick pattern that may not necessarily align with the technical indicators in the manner that would excite the first group of traders as much.
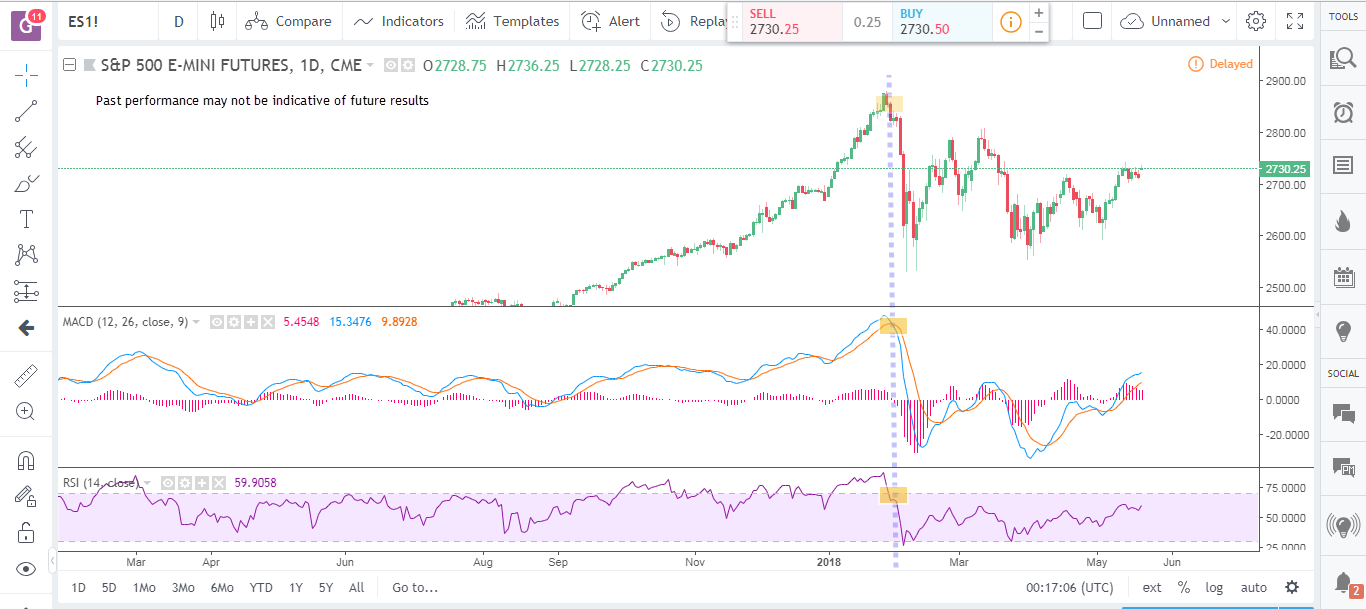
The scenario above illustrates a practical example. We assume two traders; one who uses a simple indicator based system that signals a market entry when the MACD lines crossover and the RSI indicator exceeds overbought/oversold region followed by price making a move in the anticipated direction. The other trader relies on riding strong trends using price action signals (chart and candlestick patterns) as primary entry triggers and uses the MACD only to spot divergence as an added confirmation to trade setups.
The vertical dotted line points to an instance when the MACD lines crossover and the RSI is in the overbought region. The market also prints some bearish candlesticks making for a potential short entry. Note that the other trader, who is not using the same tools and methods, could still be looking forward to a long entry at a pullback into the solid uptrend, and hence would have never seen the short opportunity coming (we didn’t get a bearish candlestick pattern like a pin bar that could have triggered this trader to hold a short bias).
Let’s look at another example. This time we won’t make conflicting biases appear as natural as when separated by the different trading realms of indicator based trading and price action based trading. We take two traders and both trade price action only and use horizontal support and resistance levels and chart patterns to pinpoint high probability trade setups.
Here’s the perspective of the first trader who has a short bias on the market:
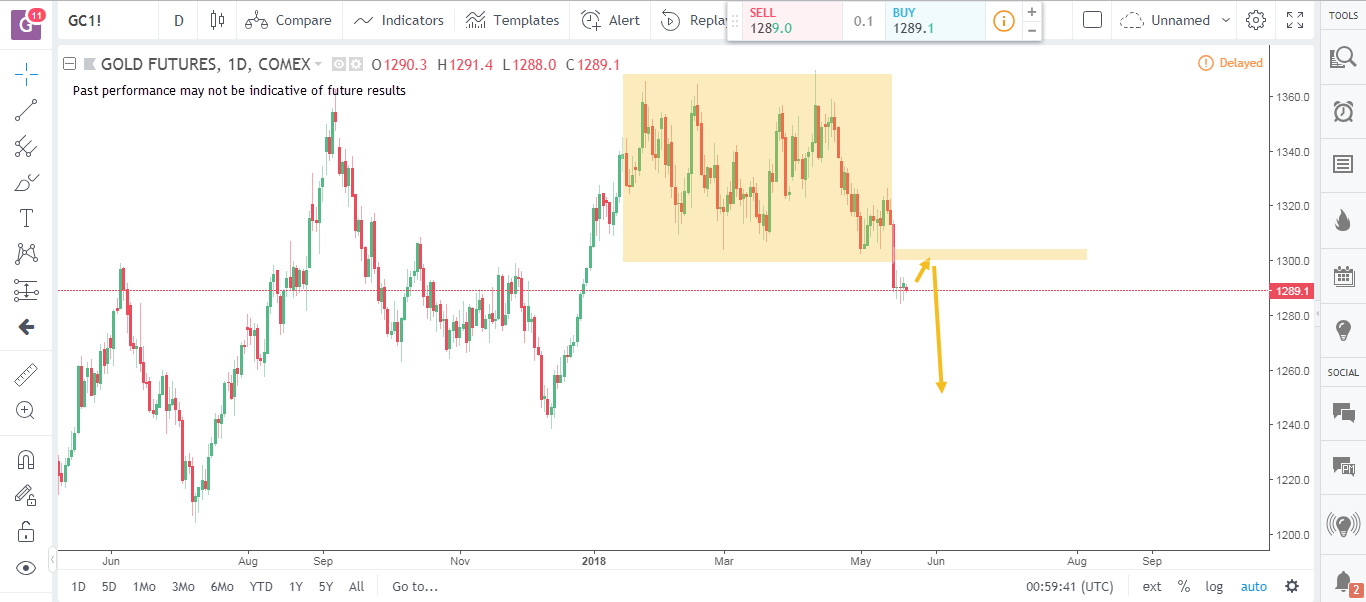
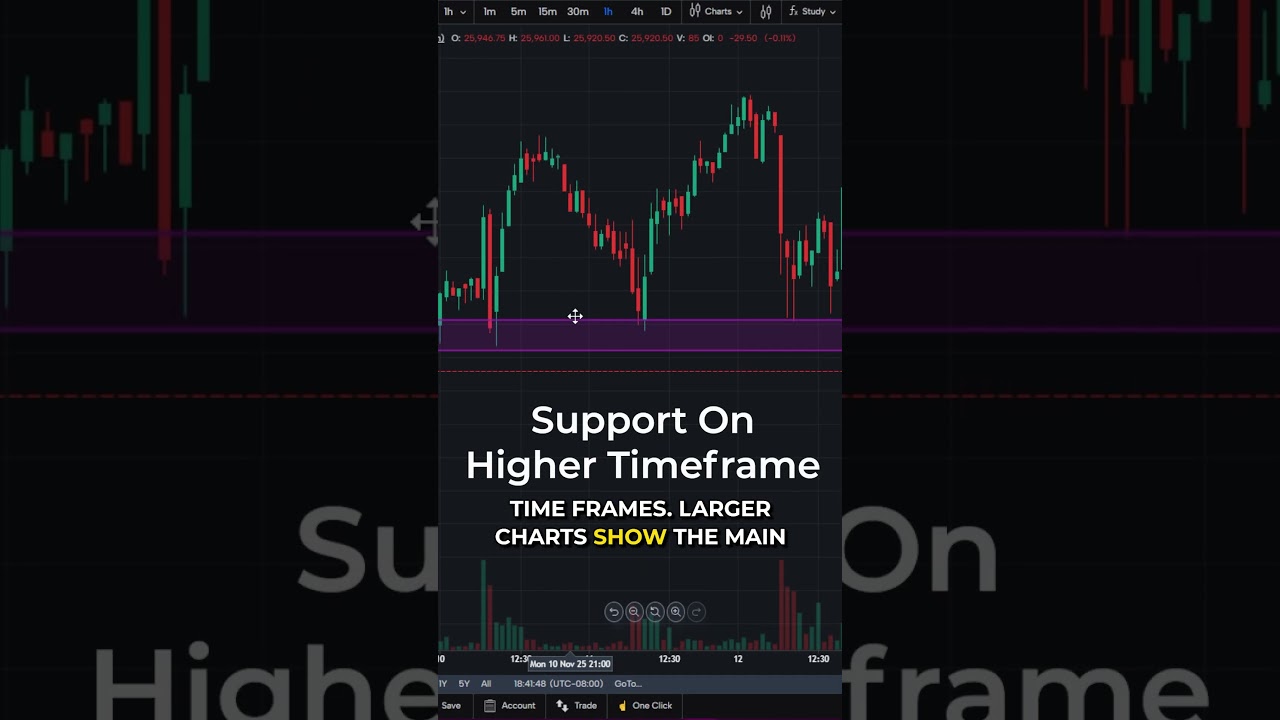
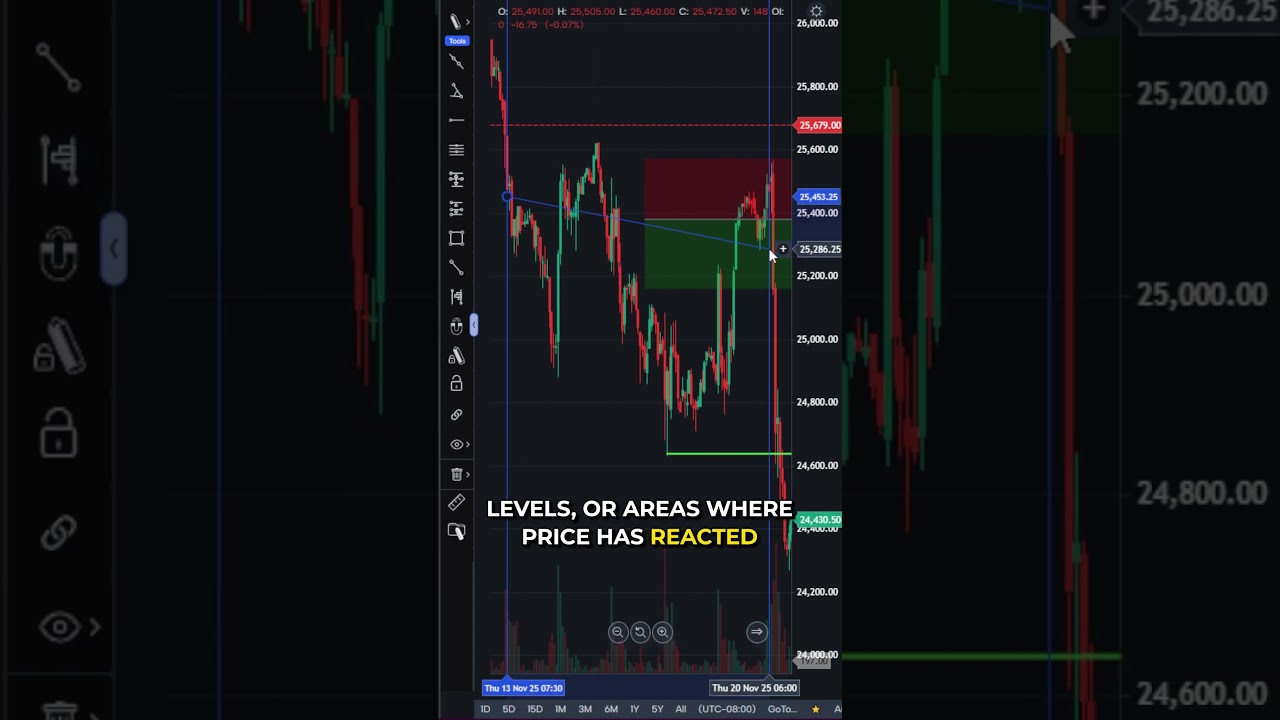
He or she sees the market as broken out of a consolidation phase and is looking at the minor holdup as an opportunity for the market to pull back, test the broken area as resistance and continue moving down. Now let’s consider an opposing view of another trader from the same school of thought and trading method.

This other trader sees the current holdup at a region of solid support marked by the horizontal support and resistance zone and in confluence with a longer term rising support trend line. This trader, therefore, has a long bias and is actually looking to find a long entry trigger.
As you may observe from the above-mentioned examples, at any given moment in time a live market can be analyzed in different ways, often resulting with strikingly opposite biases and viewpoints. What does this mean to you as a technical trader striving to fine tune your chart reading skills and looking to improve your overall trading results? We address this in the next section.
If you carefully observed the above-mentioned examples, you may have noticed how a bias can often serve as a trap for a trader who may not be able to see trading opportunities timely. This is, in fact, one of the leading causes of why newer traders often struggle to post consistent results. It is very common among these inexperienced traders to develop biases that they want to swear by unless the market makes a considerable move in the opposing direction, which always keeps these traders a step behind more pro-active traders.
The Need for Adaptation
It is critical that as a trader you are willing to fully adapt to live trading conditions and challenge your pre-conceived notions and biases at all time to confirm their validity. Part of the logic behind being more flexible in your analysis has to do with the rather fickle nature of market behavior itself.
Trends that look good at a certain time can potentially reverse sometimes without the necessary triggers and signals you may be accustomed to look for in order to identify such trend reversals. Range-bound markets can spring into lucrative and decisive moves, and comfortable rhythmic swinging markets can enter into notorious sideways phases, often without warnings as well. Unscheduled and spontaneous news events and fundamental developments can lead to the market spiking in periods of volatile trading and breakout trading scenarios can occasionally reverse into fake breakouts.
There are times when the market behaves exactly as a trader would typically expect it to, but the challenge comes in seeing the market as it transitions and reacting in a manner not conceived by the trader. Strict biases can do more harm than good and deprive the trader of the needed flexibility and adaptability that should accompany fickle market behavior.
The Need for Holistic Analysis
This is another major hurdle that newer traders face leading to stiff market biases that blind them to lucrative trading opportunities.
It is imperative to analyze your market from various perspectives, including different time frames, potential correlations, and scheduled fundamental developments. Such ‘peripheral’ factors are often not considered by amateur traders who appear to be preoccupied with finding the perfect entry points as defined by their specific trading systems and market biases. Even when applying the more regularly used analysis tools like trend lines and horizontal support and resistance levels, traders must look at all possible perspectives.
As the examples above illustrate, sometimes drawing a trend line across another set of swing points, or stretching your Fibonacci levels across another market swing can yield interesting perspectives that you may not have addressed in your analysis yet.
While it is discouraged to have a complex multi-faceted trading system that tried to incorporate various elements to accommodate the need for flexibility and adaptability, such restrictions may not necessarily apply to general market analysis and for the purpose of developing/reviewing biases. Proven trading systems will often require objective entry and exit criteria which can be crucial to your long-term trading success, but traders should also consider the various factors in their general analysis for the market to open their minds to newer possibilities to apply the trading system to. For example, a notorious sideways channel on the daily time frame can potentially frustrate a trend trader, which can often be eliminated by the simple move of using the same system and rules on a lower time frame that may present a different more favorable trading environment.
We began the article by highlighting how live market action is really just made up of buyers and sellers interacting at the given price level – a market characteristic that inherently points to conflicting biases. Whilst it is impossible to never have market biases, professional traders separate themselves from the average struggling traders by virtue of dynamic market biases and keeping an open mind to explore all potential lucrative trading opportunities, rather than getting locked down into myopic perspectives.
There is a substantial risk of loss in Futures trading. Past performance is not indicative of future results.