Dojis are among the most popular candlestick patterns; they are easy to spot, happen frequently and visualize an important market structure. A Doji candlestick consists of 2 candle-shadows to both sides and a small body – typically, the body is just a single line when the open and the closing price of the Doji fall at the same level. However, Dojis don’t necessarily have to open and close at the same price. A reasonably small body can also be considered a Doji pattern – it is more about the psychology and the balance between buyers and sellers that are important and not the exact shape.
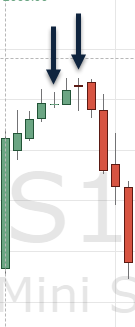
The screenshots below show 2 classic Doji patterns. To read and interpret Dojis correctly, it is also important to consider the candles before the Doji and the first candle immediately after the Doji. A Doji after a rally and a subsequent bearish candle can foreshadow a bearish reversal. On the other hand, a Doji after a sell-off and a subsequent bullish candle can signal a bullish reversal.
 |
 |
The psychology behind Dojis
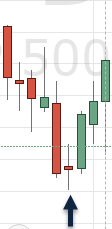
In order to interpret Dojis, it is important to understand the implications of a Doji candle. Let’s examine the scenario below. After a sell-off, price showed a Doji – not a perfect one since the body is not just a flat line, but it’s close enough to count as a valid Doji.
During the sell-off, price moved lower, but buyers suddenly entered the markets and pushed price back up which lead to the formation of the Doji. The candle immediately after the Doji does not have a shadow to the downside at all. After the Doji, price only moved higher.
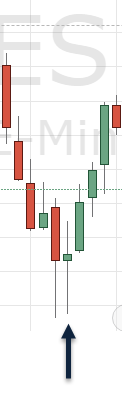
This is a classical 3-candle Doji reversal pattern: sell-off, Doji, bullish candle. Combining the information provided by the three candles, we can understand the price dynamics and the balance between buyers and sellers much better.
Doji + location
To increase the predictability of Dojis, the component location plays an important role. Instead of randomly jumping on a Doji signal, traders should look for a Doji candlestick pattern at a meaningful location.
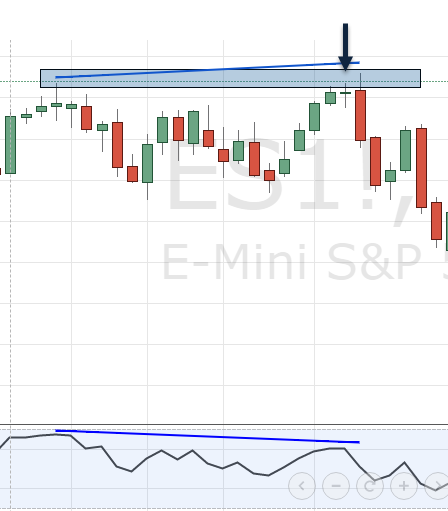
Support and resistance, Fibonacci retracements and pivot levels are typically the best tools to increase signal accuracy. A Doji after an uptrend that occurs at a resistance level is often more meaningful as it pins down the indecision at a high impact price level rather than just picking a Doji at a random price.

Doji + indicators
To improve signal accuracy even further, consulting indicators is the next step. Especially momentum indicators such as the Stochastic, the RSI and the MACD can greatly improve the signal predictability when trading Dojis and candlestick patterns in general.
The divergence signal is probably the most accurate Doji confirmation signal. A divergence on momentum indicators show that the most recent price move is not supported by momentum. For example, a RSI divergence after an uptrend shows that although price moved higher, the strength of the bullish price move has decreased. A RSI divergence that is accompanied by a Doji at a resistance level is usually a much more accurate signal than just a Doji by itself.
It’s all about building confluence
The key to building a robust trading approach is combining different concepts and tools in such a way that it supports the overall idea of the method. With Dojis, traders try to identify price reversals; a reversal at a support/resistance level is typically more meaningful than a reversal at a random price level; moreover, a reversal supported by a Doji, at a support level and confirmed by a momentum divergence is even more meaningful.
There is a substantial risk of loss in futures trading. Past performance is not indicative of future results.