This article on Market Reversals is the opinion of Optimus Futures.

How do I know when this market will turn on me? A fundamental question all traders ask themselves at some point in their career.
There is no concrete and objective way to predict a market turnaround every single time, and as such cannot be learned as part of a repetitive process that builds a special skill. Note the keywords in italics in the last statement. While it may be perfectly practical and achievable to develop a skill set that allows a trader to observe some repetitive market reversal phenomenon that may be fairly reliable in certain market conditions, doing so at all times is a near impossibility and most definitely beyond the scope of this article.
With the disclaimer out of the way, we now delve into specific price action behaviors, patterns, and phenomenon that are fairly repetitive in particular conditions where the market may be mulling a reversal. Keeping a watch out for these behaviors can potentially go a long way towards potential profitability and consistent results in this business.
Watch for Deep Pullbacks
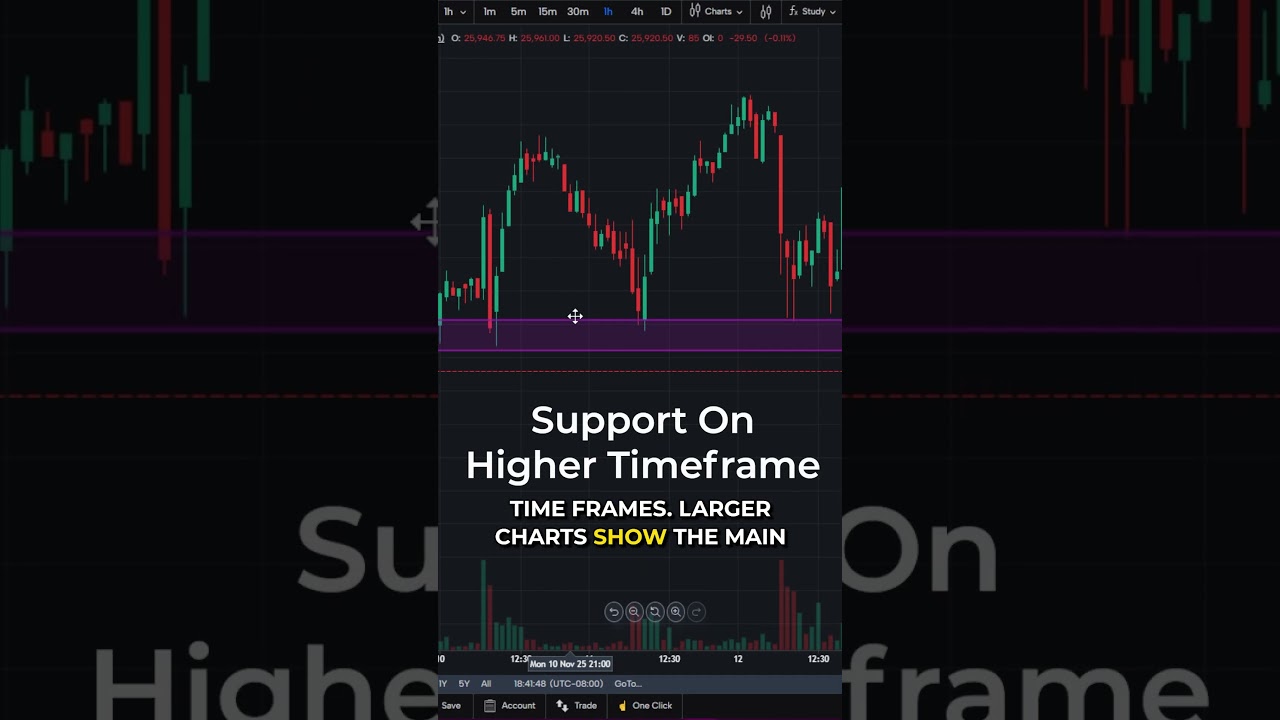
One of the most important factors you need to consider when analyzing a potential market top or bottom is the overall strength of the preceding trend itself.
A solid up trend will be marked with higher highs and higher lows (or lower highs and lower lows in the case of a dominant down trend), with occasional but non-threatening pullbacks that are vital to the longer term health of the uptrend.
Traders often misconstrue pullbacks into the trend as a sign of weakness. But if you notice, sharp and extremely vertical movements in one direction hardly ever sustain themselves over the long haul. On the contrary, longer term up trends tend to feature occasional pullbacks as a means to more consolidation and momentum generation for the dominant party in the market. A point to note here though is that we repeatedly mention the term “non-threatening” pullbacks, which refer to shallow pullbacks into the trend, unlike deep or extended retracements.

Referring to the chart above should help us clear this point even more. Notice the pullbacks into the down trend marked by golden arrows. Notice how they represent shallow retracements into the down trend. Compare these pullbacks against the extended pullback marked by the red arrow. Clearly, we see a major block of buy orders come into the market taking prices much higher – and deeper into the downtrend. Later as sellers try to regain control, you should notice how the market stops dead at the point where the ‘threatening pullback’ initially began creating a swing low.
If you see a market trend transitioning towards more frequent and deeper pullbacks, chances are that the trend may potentially be losing momentum, making the situation ideal for one looking for reversal trade setups.
Watch for Divergence
Looking out for divergence is another extremely popular tool that technical traders often use to determine the health of the trend.
The main idea propelled by a diverging market is that while the trend may appear to be intact (higher highs and lows for an uptrend, and lower highs and lows for a down trend), the momentum or the relative ease with which the market may be moving forward could potentially be slowing down, possibly becoming an early indication of an upcoming reversal of the trend.
Divergence is typically spotted using some of the common oscillating technical indicators that are tied to price, such as the MACD, the RSI or the stochastic indicator. The idea here is that if the higher highs on an uptrend and lower highs on a down trend on the price chart do not concur with the corresponding highs and lows on the technical indicator, we likely have divergence coming into the market, again possibly signaling an impending reversal.

As you will notice in the chart above, the market continues to print a lower low in line with the downtrend but watching the MACD reveals more. We, in fact, have the MACD printing a higher low that runs as a sharp contrast to the rhythm on the price chart. For an informed technical trader, the following reversal should not ideally be a surprise at all.
While regular divergence is a common tool technical traders use, there is a less common tool most traders usually miss out on that is used to identify weakening market momentum – and which relies on nothing other than price action itself. We call it implicit divergence.

The chart above holds a visual explanation of the above-mentioned concept. In a typical down trend, you would expect the market to regularly print candlestick lows and close well past the prior candlesticks. That’s how price moves down with authority in a dominating down trend.
However, when the market is struggling for momentum, you will often find candlesticks failing to close below the prior candlestick’s low. They might still be closing bearish (or bullish if the trend in consideration is a bullish one) and the ‘wicks’ on the candlesticks could continuously be protruding lower, but it could well just be an illusion.
Just like in the case of regular divergence where the continuity of lower lows (or higher highs on an uptrend) could trick an uninformed trader into thinking the trend is still strong while the MACD prints contrasting highs and lows, implicit divergence too could paint the illusion that price may still be pushing into the direction of the trend, but watching the close on candlesticks could reveal useful information about momentum.
For more information and insights on implicit divergence as a standalone concept, visit our detailed and dedicated article on the topic here.
Watch for Sharp Price Movements
This factor often comes as a big surprise to newer traders. After all, if price rapidly moving in the direction of the trend and hopefully our trade is what we want right? Well not exactly. From our earlier discussion in this article, recall that we talked about healthy trends posting occasional non-threatening pullbacks to ensure the longer term continuity of the trend. This is because extremely steep movements in either direction cannot be sustained by the market for the long term. This piece of insight is invaluable also to a trader looking out for a reversing market. We will investigate with a visual.

We will take up what is possibly the most talked about market condition for the year so far: The S&P 500 market selloff from February this year. Prior to the sharp selloff we had the market towering towards new all-time highs almost every week.
Notice that as the trend rises steeper and steeper while the occurrence of the golden arrows, each of which marks a pullback into the uptrend, continues to diminish. In fact, 17 trading days that lead up to the sharp sell-off at the start of February, we had only two days where the market closed lower than it opened – and that too in a very non-ominous way.
Unsurprisingly, technical traders that prefer to just go with the flow were likely shell-shocked by the February sell-off, while professional traders who understand market dynamics could potentially have seen it coming.
The logic, if you try to comprehend it, is actually pretty straightforward. A smoother trend marked by frequent pullbacks underscores the normal interaction of buyers and sellers. On the other hand, a sharp movement for example towards the upside could easily depict a situation where the sellers could be uninterested in selling. This can lead to a “vacuum” in the market allowing buyers to quickly and easily bid prices higher in the face of minimum resistance. Often times, this lack of interest from sellers serves as a trap as sell orders actually pile up at higher price levels, which when hit, can result in price often falling back against the ‘supposed momentum’ just as hard.
For a trader mulling the possibility of a reversal on a trend, especially as the market is approaching a key historical price level, a sudden and sharp price movement in the direction of the trend could actually serve as a potential reversal indication.
Important Note
Before we conclude the article, it is vital for you to understand that none of the concepts explained above yield a fool-proof method to accurately predict market reversals in all market conditions. Watching for the overall health of the trend, divergence, and sudden price movements can all hint at the possibility of a market top, but in no way serve as standalone predictors. As it is with almost all technical analysis tools and concepts that traders use today, it is all about grouping the right indications and analysis perspectives to form an overall directional and trading bias.
There is a substantial risk of loss in futures trading. Past performance is not indicative of future results.