This article on Ways to Execute Trades for Quick Sharp Moves is the opinion of Optimus Futures.

Nothing appeases a futures trader more than to find a trade run instantly in the green upon execution. It is sometimes a result of careful analysis and handpicking the right trade setup at the right time, while other times it can be plain luck. Either way, such trades allow for easier trade management and lower stress levels and are therefore highly desired.
In this article, we look at five aspects that could potentially help you find more “instant runners”. As mentioned, even though such trades can at times be the result of luck, studying market dynamics and understanding why and when the market is more likely to post a quick strong move in one direction helps us connect those instances to possibly well-timed trade entries.
Execute Trades with Higher Probability
One of the primary roles of a successful trader is the ability to separate mediocre trades from higher quality trades. Some traders strive to place objective rules in place that allow them to take only the best trade setups, while others rely on experience and intuition to filter out the ‘noise’ or below par trade setups. On the other end of the spectrum are aggressive traders who rely on sound trade management to accommodate a higher number of trades that usually also encompass average trades.
A high-quality trade setup could allow for a quick sharp movement in the preferred direction, while an average trade can sometimes struggle to do so. We will be looking at specific elements of high and low-quality trading scenarios later on, but this section looks at the holistic picture that compares high-quality trade characteristics to generally low-quality trade setups.

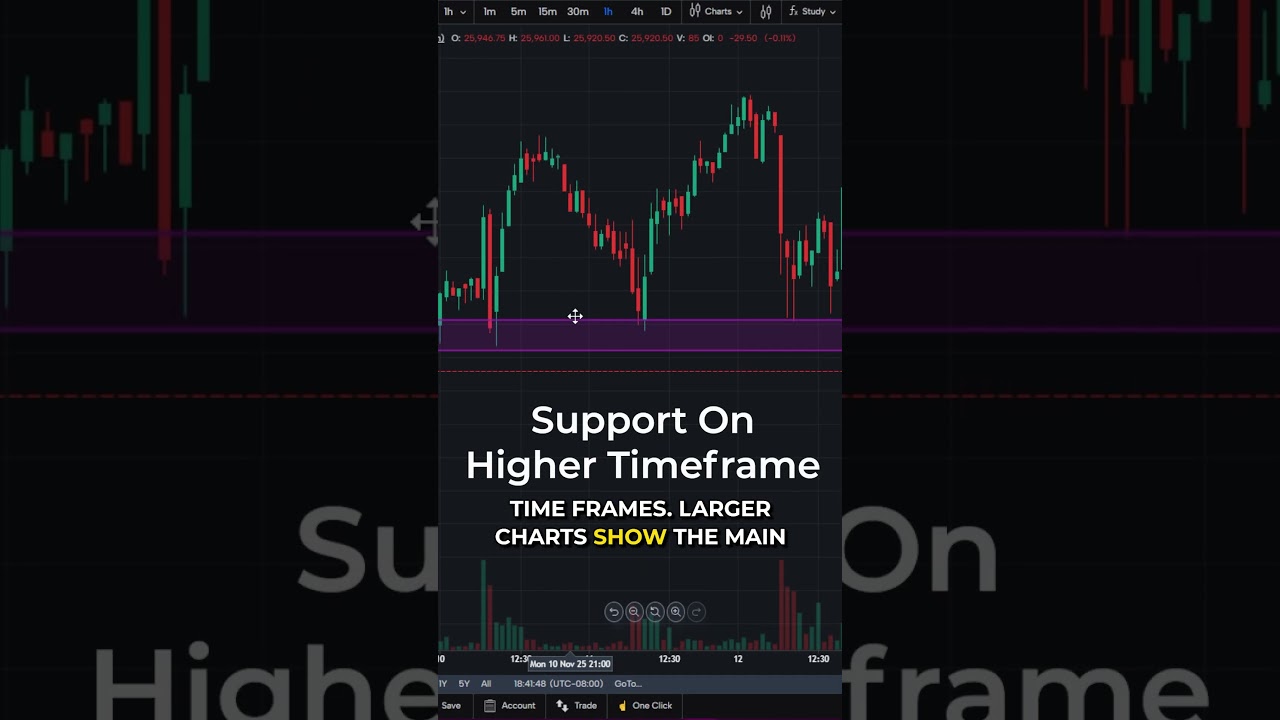
The chart above presents a case for a high-quality trade setup – a bullish engulfing candlestick pattern at a swing low, which is typically where these patterns are expected to be the most useful. Notice also, that as price moves north, there are fewer hindrances in terms of short-term side to side support and resistance levels to hold the price up – in turn allowing for the price to swiftly move up. We look at this aspect in detail in the following section.
Traffic Vs. Space
Trades that run straight into near-term support and resistance levels created by recent bar highs and lows in the past can be more prone to friction and are harder to get a quick sharp move out of in the anticipated direction.
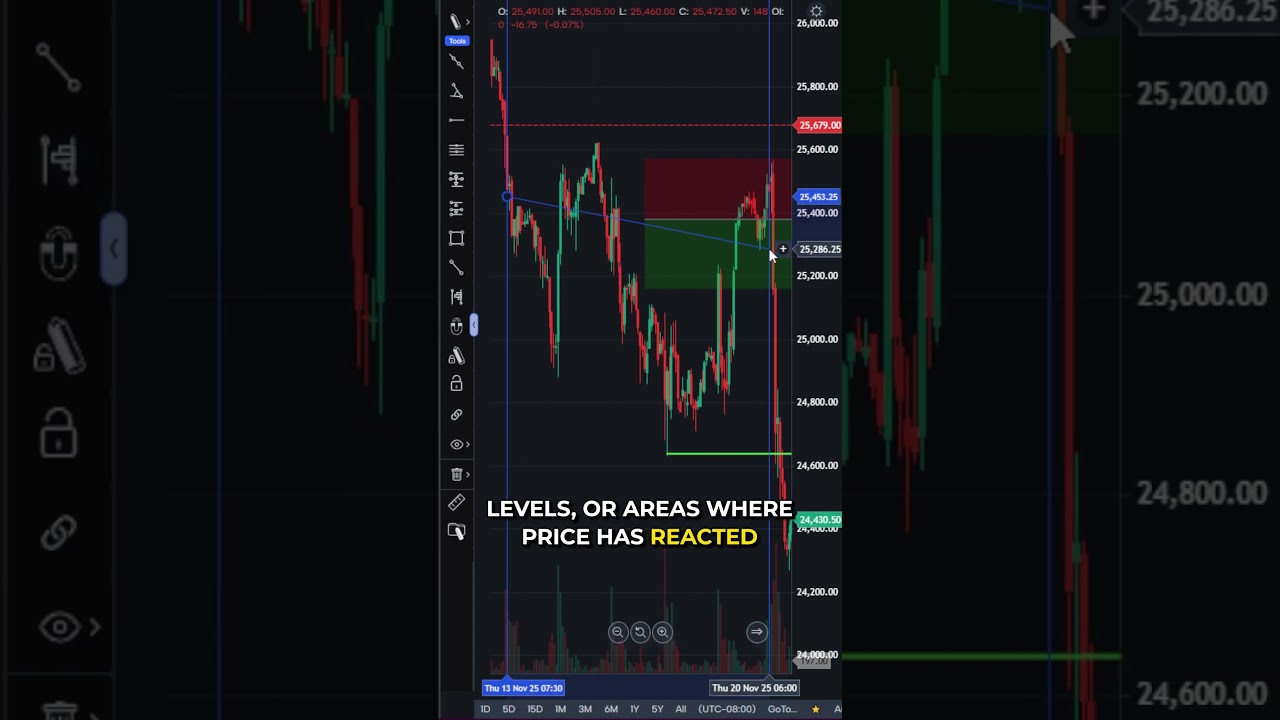
On the other hand, trades that have more room to run and are not immediately hindered by a near-term support and resistance levels tend to be better positioned to unfold to the desired outcome. The chart posted above is a textbook example of such a trade setup. Notice how an apparent potential resistance area formed by prior bar lows from a consolidation period is some distance away, allowing for the price to move up to that level rather swiftly.
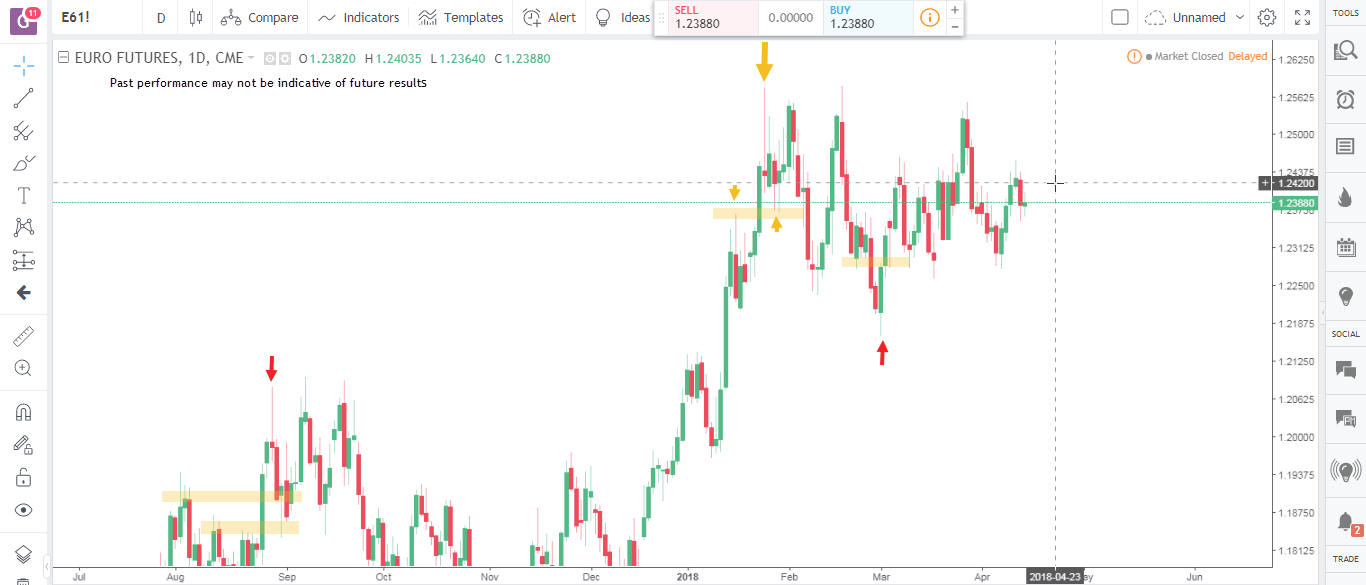
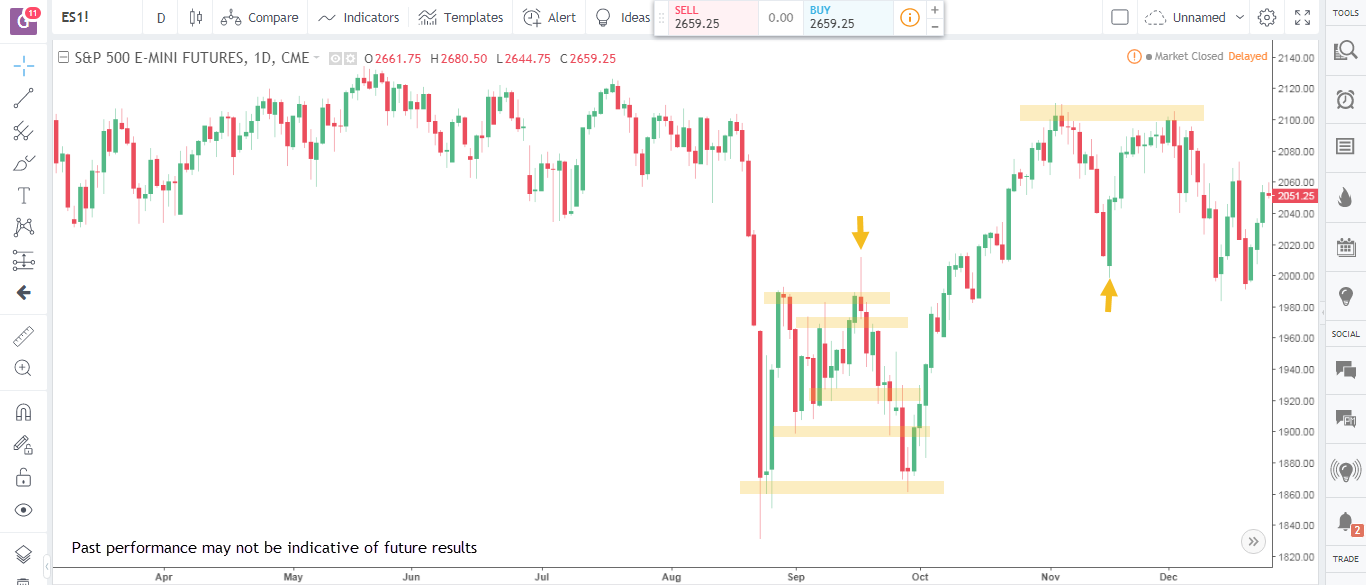
Here is another chart for more reference. Focus on the bearish pin bar marked by the bold arrow in gold. It is at a swing high and has an authoritative look to it, which is what a trader should be looking for when trading pin bars. However, notice how taking a short trade after the formation of the pin bar would have resulted in a ‘tight’ trade because of a nearby former resistance level marked by a minor swing high. You will note that price bounces off of it and would have resulted in a drawdown on the trade for a while, before eventually running in favor of the trade.
We have highlighted two other candlestick patterns with red arrows that are at seemingly desirable locations but are also running into ‘high traffic’ areas calling for stricter trade management and a lower probability of a quick sharp move in your anticipated direction.
Broader Market Rhythm
Naturally, the more expansive market rhythm will play a prominent role in how you perceive (and experience) a freshly executed trade unfolding. A tight market caught up in a narrow range or a market trading on low volumes and interest is less likely to present you with a strong move in your anticipated direction than a smoothly swinging or trending market.
This point also connects with our previous discussion on traffic and space. A sideways market is usually prone to the problem of high traffic, and unless you are looking for a breakout trade past all the consolidation, it is increasingly difficult to expect quick initial moves on trade setups. On the other hand, swinging and trending markets will usually present more opportunities and trade setups that post brisk initial movements. When taking trend continuation setups, for example, a trader should be looking forward to a brisk move in his or her favor as a confirmation of the analysis and trading decision being right.
Definitive Targets
Sharp and quick price movements in a market could present an opportunity for traders to trade at their desired price level (or levels). These ‘desired price levels’ could be round numbers, significant support and resistance areas or other areas of interest which act as targets in your trading plan. At times, you may see the price action in the marketplace rather “rushing” to test these levels.
Traders who like to throw around technical jargon talk about the impact of a ‘liquidity vacuum’ in a market as defined by a sharp movement in price resulting from a noticeable lack of interest from either the buyers or the sellers. Take the case of price rushing towards a visual resistance area. Naturally, the sellers would want to execute their trades at the resistance level rather than under it, resulting in lower interest from the sellers while the price is still under the resistance level. This can momentarily tip the balance considerably in favor of the bulls, which on our charts will be represented with a sharp move up until price hits the resistance level.
Translating this into the theme that we are discussing, imagine taking a bullish engulfing candlestick pattern trade that is headed into a region with an apparent visual resistance area that you could potentially identify as a likely target for your trade.
Here is a chart with the same scenario. Pay attention to the bullish engulfing candlestick pattern marked on the chart. Notice how the resistance area highlighted acts as a target level for the market as it breaks above the bullish engulfing pattern. Anticipating a quick move up into that resistance level, indeed could not have been ruled off. On the contrary, notice the bearish pin bar also marked on the same chart. Notice how being in traffic, this pin bar does not have a clear-cut potential support area to head to. Although in hindsight the setup did play out well, these are usually the kind of trades that can be hard to expect.
Fundamental Developments
Finally, we’ll talk a bit about the notorious fundamental developments that unsurprisingly can make a market jump and when on the right side, can result in brisk movements in your anticipated direction. News traders prefer to feed off the momentary volatility and sharp price movements that essential news announcements (usually scheduled like non-farm payrolls, Fed meeting minutes, etc.) can bring.
Being savvy and watchful of key developments can save you from volatility spikes, but doing so can also present lucrative trading opportunities if you understand the role that fundamentals and new events can have on the markets you are trading. Being on the right side of the news can frequently bring swift runners to your trading journal.
Consider the S&P 500 Emini Futures market in recent months. Primarily, all the significant moves down witnessed in this market over the past two months can be partially attributed to vital fundamental developments like interest rate hikes, rising concerns of inflation, and the country’s macroeconomic ties with other economic behemoths like China.
In the above sections, we looked at some situational factors that can potentially generate the highly desired aspect of seeing a trade run into floating profit right from the word go. The list by no means is exhaustive enough to accommodate all possible factors, nor does it subtract the everyday old ‘luck’ element when it comes to individual trades shooting in your direction, and others failing to do so. However, being aware of the above factors can potentially bring you a step closer towards having a reference system for your favorable setups.
There is a substantial risk of loss in Futures trading. Past performance is not indicative of future results.