The ability of being able to distinguish between breakouts that fail and breakouts that succeed is an important trading skill. Many traders run into problems by making the wrong decision prior to a potential breakout and falsely estimating the likelihood for a successful or failed breakout. In this article, we will share 7 principles of technical analysis that will help you trade breakouts effectively and find breakouts that lead to potentially large trending moves.
Pullback and retest
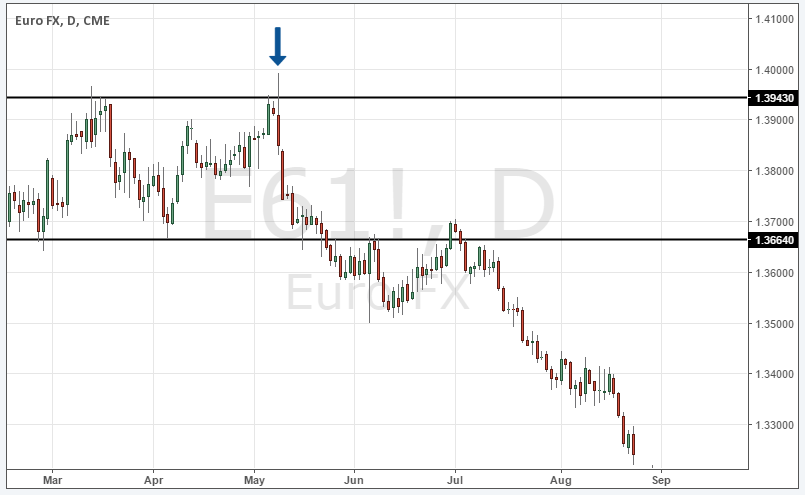
This is your odds-enhancer when trading breakouts around support and resistance levels. Breakouts rarely lead to runaway trend moves; it is much more common to see a breakout, followed by a pullback and a retest of the initial level.
We understand that FOMO (the fear of missing out) is a common bias and being scared of missing large trends is what makes people enter trades too early. However, waiting for the successful retest of a breakout level can improve your trading and the way you look at price action. Of course, this will lead to some missed trades that just take off, but you’ll also be able to avoid many false breakouts.
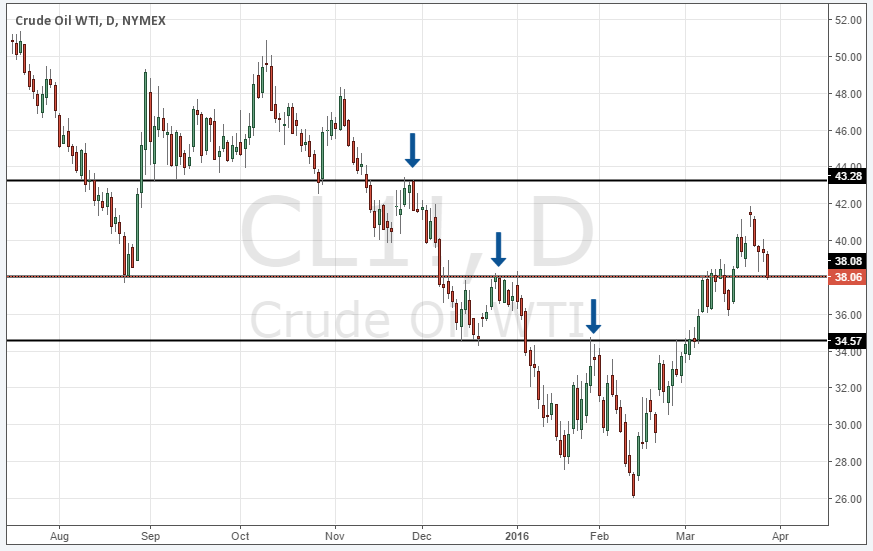
Charts Courtesy of TradingView
Odd enhancer II: only trade in the direction of the trend
Another great filter is only taking breakouts that are in line with the overall trend. Thus, you should always take a look at your higher time frame and see if you are in an uptrend or a downtrend – moving averages are ideal tools here – and then only look for breakouts in the direction of the higher time frame. The momentum is usually much greater in the direction of the overall trend which helps you filter out failed breakouts that are essentially just pullbacks on the higher time frame.
The Bollinger Band trend
The Bollinger Bands are a multi-facetted tool and they can also be used when estimating the likelihood of a breaking failing or succeeding. When you see that price is trending along the outer Bollinger Band it signals a strong trend that is likely to continue. On the other hand, a breakout that occurs while price is in the middle of the Bands has a much lower chance of succeeding.
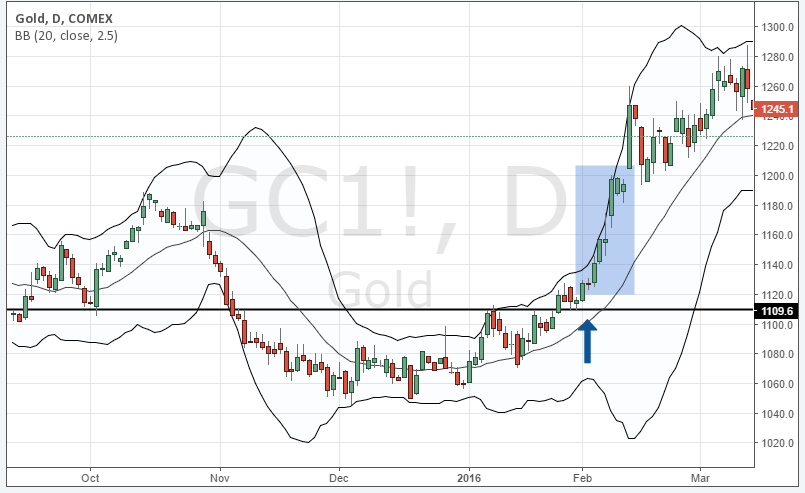
Charts Courtesy of TradingView
Volume analysis
Breakouts that are supported by volume spikes also provide high probability trading scenarios. A breakout that happens with low volume shows that it is not supported by a lot of traders (orders) and that a follow-through is not as likely. On the other hand, when you see increasing volume around a breakout level it shows that market participants are placing orders in the same direction and, thus, it make a successful breakout more likely.
Triangle
A triangle is an important trading pattern that can point to breakouts. When you see a support level and price is coming back to the level sooner and sooner, a triangle pattern is being created and it shows that buyers don’t have the power to move price away from the support level. Thus, it can foreshadow a breakout; a breakout that happened after a triangle pattern often has a much higher probability of succeeding.
The fake breakout before the real signal
Wycoff coined the term “spring” pattern which describes a fake breakout that occurs before a successful breakout. The fake breakout, thereby happens into the opposite direction of the following successful breakout. For example, price might show you a bullish breakout of a resistance level which fails and then immediately reverses to the downside to create a bearish breakout.
The spring pattern is a very interesting price pattern because amateur traders will usually jump on the initial fake breakout and then get tricked into taking the wrong side of the trade. During the fake breakout, amateurs will sell to the professionals at the best possible prices just before the direction gets reversed.
Charts Courtesy of TradingView
Momentum breakouts
For traders who rely on additional indicators to make trading decisions, adding the RSI, the ADX or the Stochastic can help them make informed trading decisions. A breakout that occurs when momentum is high, has a higher chance of succeeding. When your ADX is above 30 and rising, when the Stochastic is in overbought or when the RSI is above 70, a potential breakout becomes a high probability scenario, whereas low momentum breakouts should be avoided.
Breakout trading is all about creating confluence and the better you can analyse price action and combine different hints, the more effective you will be when it comes to distinguishing between real and fake breakouts.
There is a substantial risk of loss in futures trading. Past Performance is not indicative of future results.