Candlestick patterns serve as a good visual guide for both day traders and swing traders. You can recognize momentum, change of direction (rejection) and/or price confirmation. It usually takes time to recognize these patterns, but with a little bit of training and understanding, you can start seeing them in real time trading.
Single Candle Pattern
As we will see, price action traders separate between 1, 2 and 3 candlestick patterns. The 2 and 3 pattern formations are usually an alternation of the 1 candlestick patterns so it’s important that we start here first.
Generally, 2 and 3 candlestick patterns carry more weight because they offer more context in our opinion.
Yo-Son and In-Sen
We can also call them “momentum” candles because they are typically large candles without long, or any, wicks. In case of a bullish Yo-Sen, it means that price has rallied all the way from the open until the close of the candle without moving lower and the candle closed at the absolute high, indicating further strength.

Pinbar: Hammer and Shooting Star
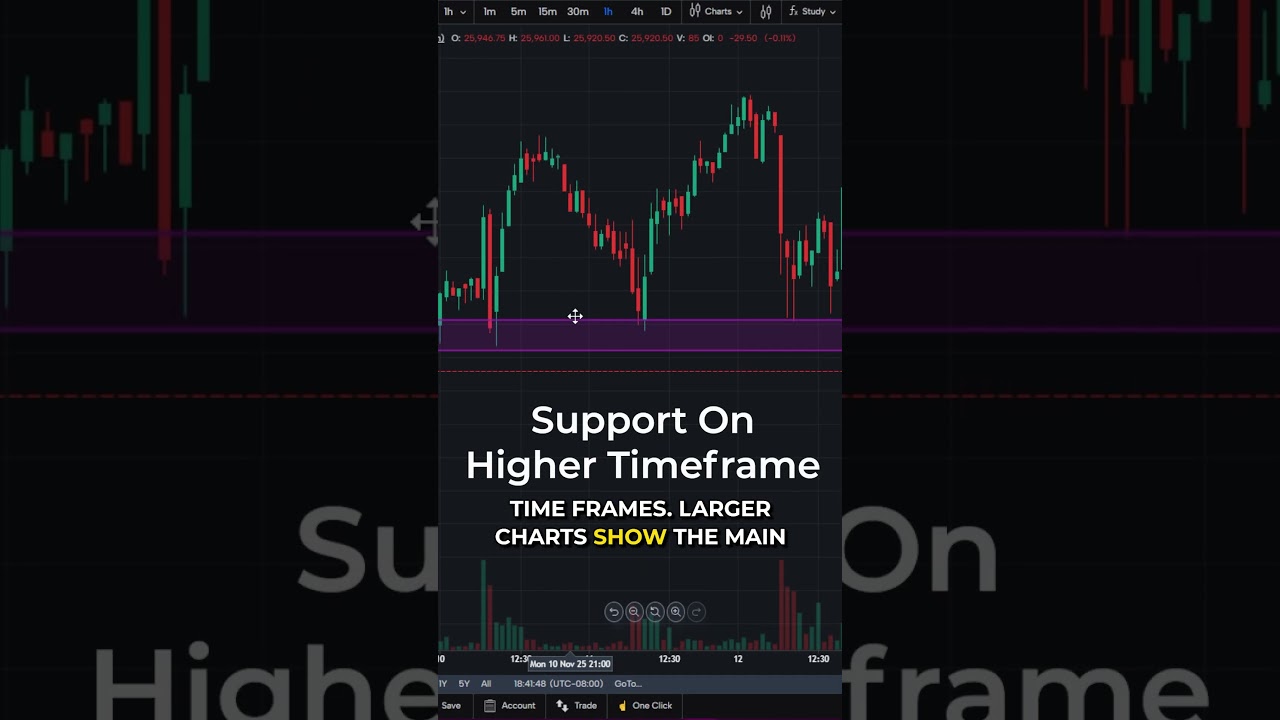
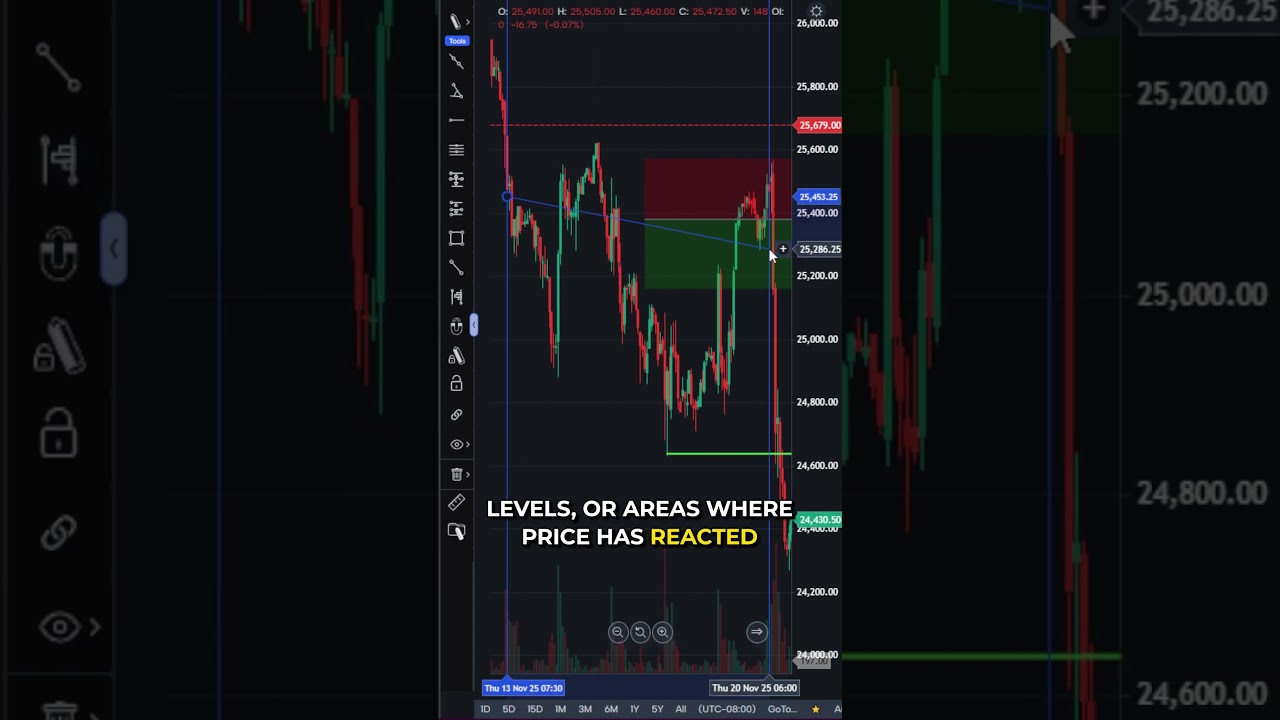
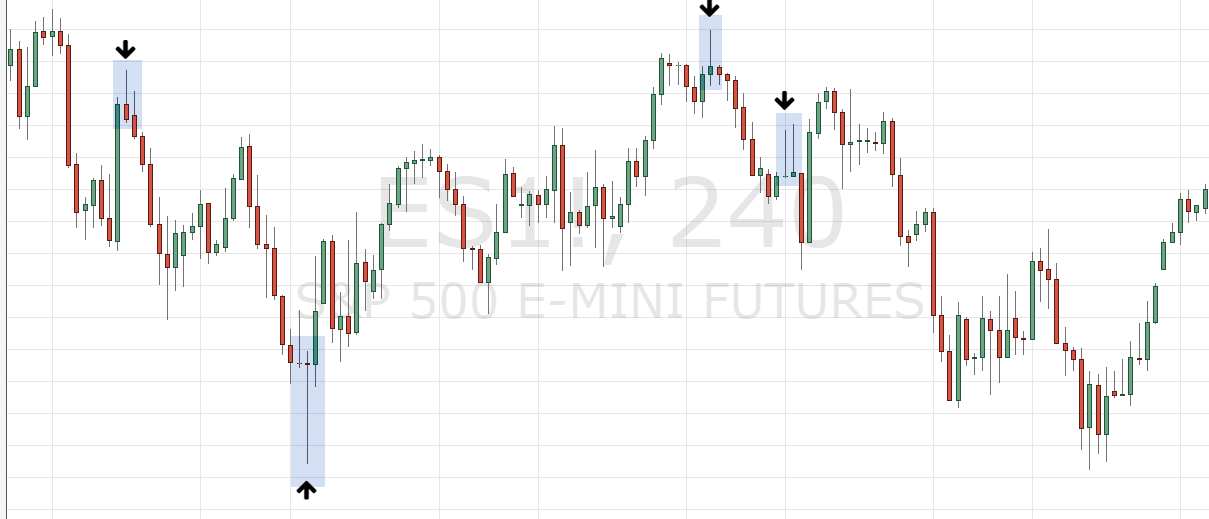
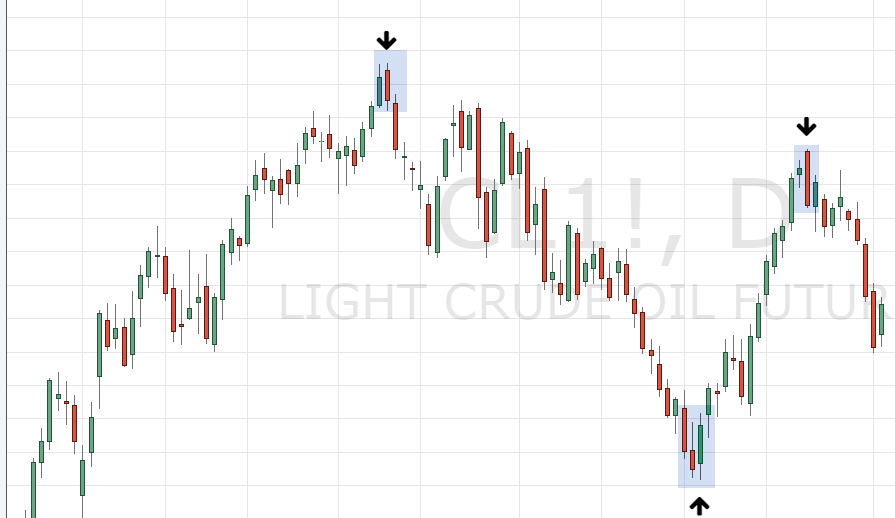
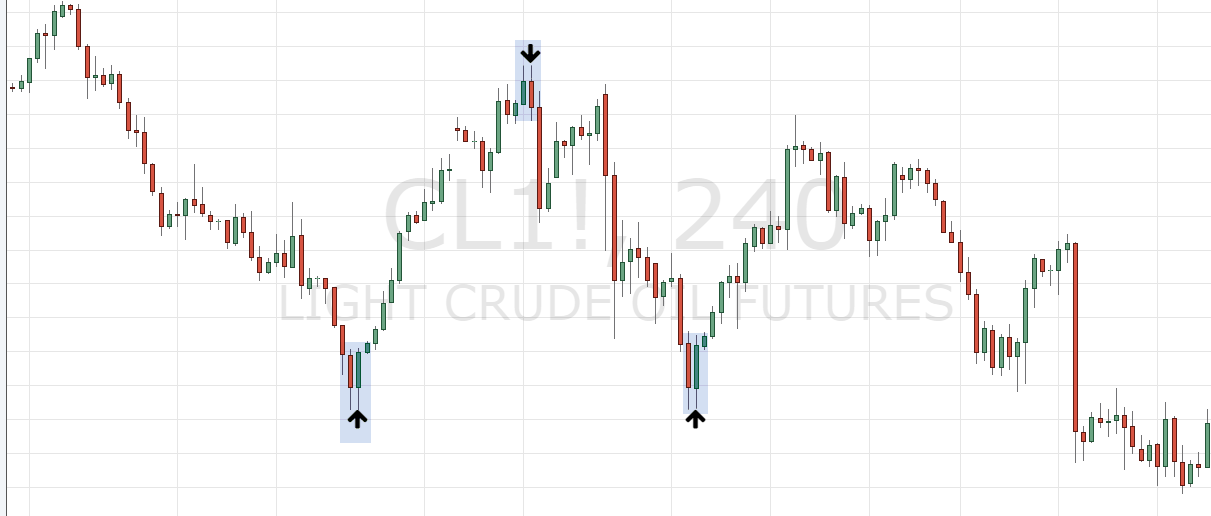
Pinbars are probably among the most commonly discussed candle patterns. Pinbars are usually rejection patterns and they can often suggest a potential trend reversal; especially when they occur at support and resistance areas, or after long trends.
A pinbar is made up of a relatively small body and a larger wick to one side. In case of a bullish pinbar, the long wick is showing a failed attempt to move higher because sellers pushed price down from the highs. The longer the wick and the further away the close from the rejection wick, the stronger usually the signal.
Doji
Dojis are often misinterpreted; some textbooks and websites classify them as reversal patterns, but they are mostly indecision candlesticks. A doji is a small candlestick with a small body and small wicks to both sides. The doji shows that price did not move much during the duration of the candle and also overall volatility was low when wicks are small.
Dojis alone should not be used to make trading decisions and it’s more important to see how the doji fits into the overall context. After a long rally, a doji could mean that buyers are pausing and waiting for a new impulse. It could also provide warning signals that the trend is losing momentum. Thus, it’s essential that a doji is always interpreted in the chart context.

2 Candles Patterns
Engulfing
The engulfing pattern is very popular and it consists of a first smaller candle and a larger second one which, as the name implies, fully engulfs the first one. Usually, the engulfing pattern is seen as a trend reversal pattern when the first candle is bearish (during a downtrend) and the next one is a large bullish bar – and vice versa for a bearish reversal.
The engulfing pattern shows not only that a trend is likely to be over, but that momentum into the opposite direction is picking up fast. The stronger the engulfing candle, the more meaningful the signal usually is.
Tweezer Top and Tweezer Bottom
Tweezer tops and bottoms are candle formations that look like double tops or double bottoms. The name tweezer comes from the two wicks which are usually of equal length and stand out to one side.
A tweezer top shows that price tried to break higher twice but was rejected both times. Furthermore, the second candle of the tweezer top pattern is usually a bearish candle which also confirms that price is going the other way.
As you can see already, the tweezer patterns are similar to the pinbar but since it’s a 2-candle pattern, we have more context which can improve the quality of the signal.
3 Candles Patterns
Morning Star and Evening Star
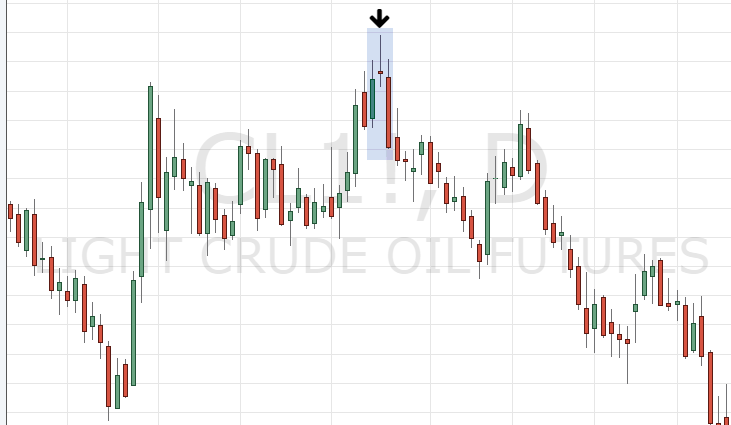
The morning and evening start patterns are extensions to the pinbar as well. In the screenshot below you can see how price is coming from an uptrend, with a large bullish candle before the pinbar. The candle after the pinbar is a strong bearish one. You can even see how price gapped up into the pinbar and then gapped lower after the pinbar which further validates the setup.
The morning and evening star patterns are classic reversal sequences where the trader can see how a trend shifts from one direction to the other – confirmed by a strong pinbar rejection.
Three Inside Up and Three Inside Down
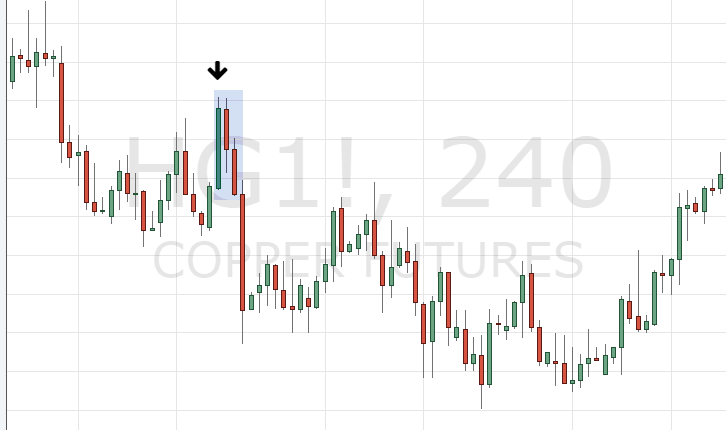
The three inside down pattern is an extension of the inside bar (which is essentially the opposite of the engulfing pattern). In the screenshot below you can see the first large bullish candle, followed by an inside bearish candle; the bearish candle falls completely inside the previous candle. This 2 candle sequence already shows that momentum is dying off and the trend-structure is changing. The third candle is then a large bearish candle which breaks out of the range. In the example below, you can see that the third candle is even a momentum candle without any wick to the downside – further confirming the strong momentum change.
Three Soldier and Three Crows
Basically, the three soldiers or the three crows are just an extension of the first Yo-Sen and In-Sen we have seen. The three soldiers and the three crows are 3 candlestick patterns where you have 3 high momentum candles after each other and they show a very strong trend. A trend continuation is very likely in such a scenario. The smaller the wicks and the larger the individual candles, the more meaningful the pattern usually is as well.

There is a substantial risk of loss in futures trading. Past performance is not indicative of future results.