This article on Breakouts vs Fakeouts is the opinion of Optimus Futures.
Most traders have experienced that moment in their trading career where an exciting breakout situation horribly turned against, getting hit by a “fakeout” that was cleverly disguised as a breakout scenario.
New and intermediate traders often struggle to differentiate between breakout and fakeout scenarios because often these setups can have similar building blocks in terms of price consolidating, or otherwise moving towards a breakout point. Except that on some occasions it appears to play out as per the textbook and other times, reverses and moves in the other direction, trapping excited breakout traders.
In this article, we look at some tips and tricks to potentially distinguish between scenarios that can be reasonably expected to unfold as only one of the two outcomes: fakeout or a breakout. Before we begin, we want to make it clear that the material that follows is meant only as a reference and a general guide and is by no means a concrete or an objective method to accurately foresee a fakeout or a breakout scenario every time.
Watch for Sharp Price Movements
Breakout traders could contest that their highest probability trade setups are often the ones that follows well-defined periods of sideways activity, as when the market breaks out of a wedge pattern, head and shoulders pattern, or an otherwise sideways consolidation phase.
It is however common for newer traders especially to get excited about a breakout opportunity every time that price approaches a critical price level. Often times, when price accelerates towards a well-defined area of resistance or support, it could well be gearing up for a reversal at the level instead of a breakout. Again this is not a hard and fast rule but general price action phenomena.

The chart above shows a textbook example of what we tried to explain above. Notice the sharp activity from sellers as price hurled down towards the swing low, and then an apparently seamless break of the low itself, appearing as if the momentum from the sellers is strong enough. However, just as you would take the move down under the swing low to be a confirmation of a breakout, the market would reverse on you.
Let’s now look at a conventional breakout setup to differentiate between the two scenarios.
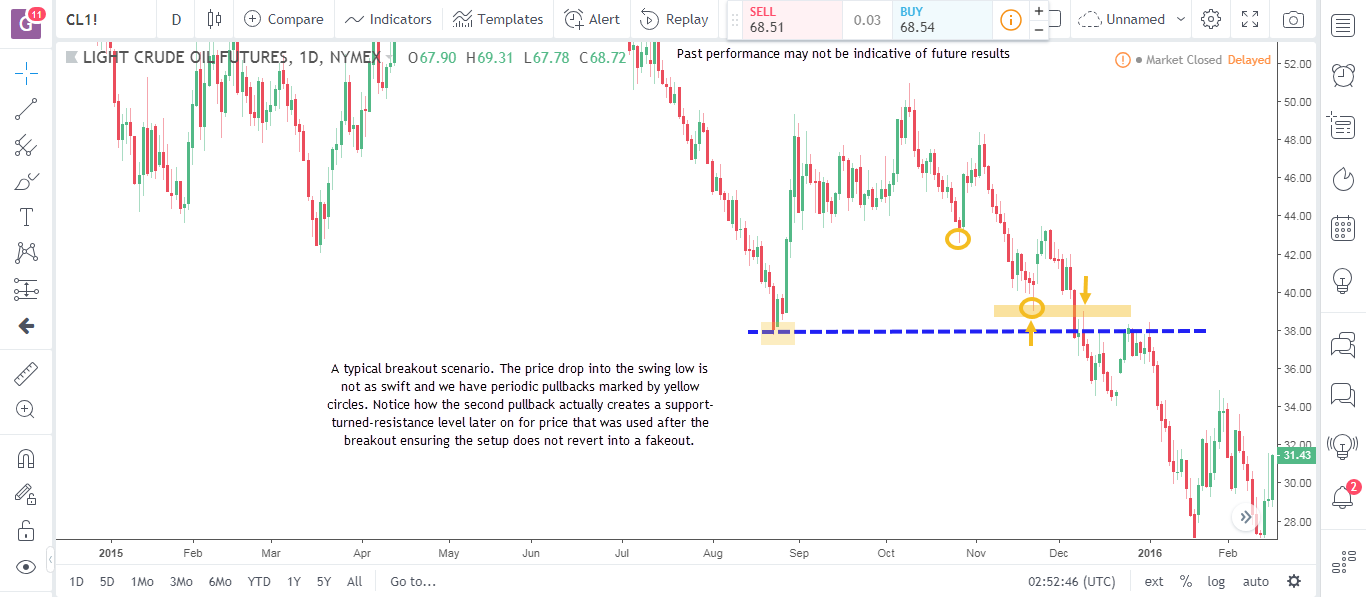
The above setup explains what to expect from a typical breakout scenario of an important swing point. The move into the swing point is characterized by normal price action with frequent pullbacks denoting healthy interaction between buyers and sellers and their affirmative presence in the market. Furthermore, these pullback points create minor support and resistance levels that later act as checkpoints that can potentially cap the development of a fake out scenario. As in the case above, notice the second pullback’s location being just above the breakout point (blue dotted line) serves as an effective short term resistance point for price, ensuring the market has all the more reasons to head further down rather than back up as part of a fakeout play.
It would be helpful at this point to go back to the first chart in this section to compare that price dropping sharply into a swing low creates a void of these short term support and resistance levels allowing price a path of least resistance when the fakeout triggers.
Watch for the Delayed Pullback
Many breakout traders watch for a delayed pullback of price to the breakout point as an effective confirmation of a breakout play, and of course as an added measure to remain safeguarded against potential fakeouts.
At the core of a fakeout scenario is a support level that failed to flip into resistance or a resistance level that failed to flip into support. Let’s look at a quick example to clarify this concept.

Notice the clearly marked swing low, and the initial attempt from the market to try and break past the swing low. That attempt obviously fails as the market is seen returning back to test the breakout point. This is where seasoned breakout traders should be found glued to their screens and live action.
If price had held as resistance at the former support level and breakout point, the sellers would have supposedly driven prices much lower in a typical breakout play. However, we see that price is allowed as easy way back above the breakout point, which is then used as support again to allow for price to actually climb much higher – in a typical fake out play instead.
We will go back to our previous example of a conventional breakout to clear this point even more.
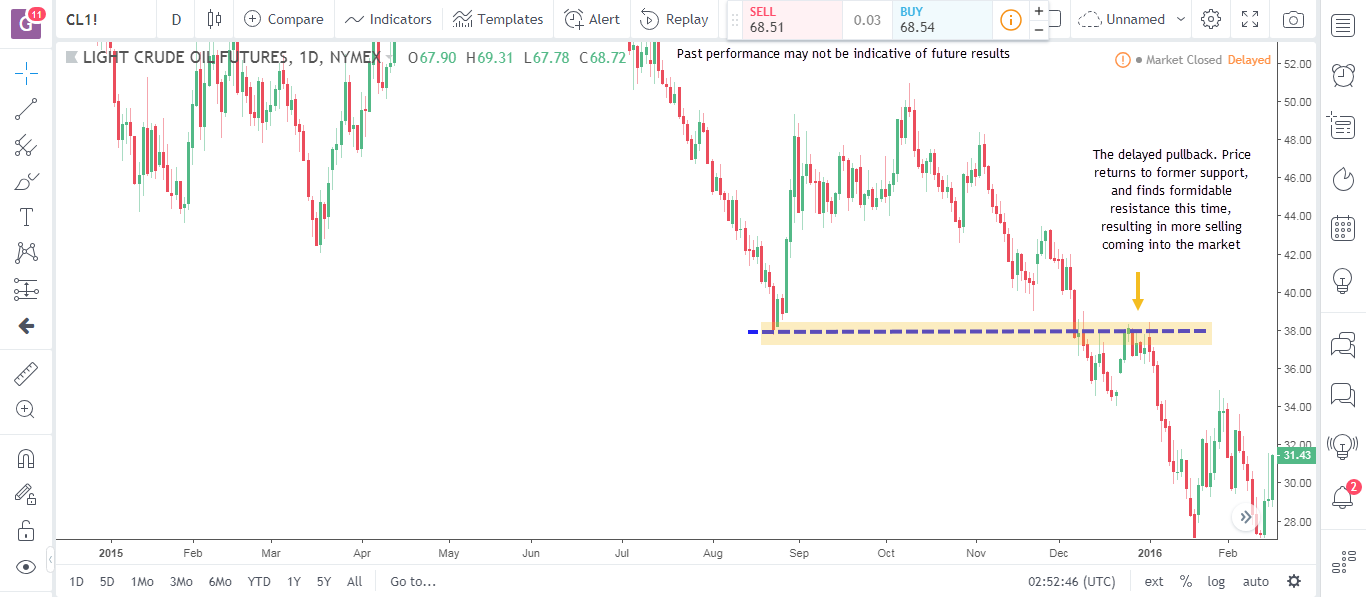
In this example, notice how price actually breaks the blue dotted line (and swing low) initially, then returns back after a short delay to test the level potentially as resistance. And we do see the level holding up well. On the chart this is obviously displayed by a string of bearish candlesticks and the lack of interest from traders to try and drive price back above the breakout point. We therefore have a solid breakout play with added confirmation from a delayed pullback.
Watch for Traffic Past Breakout Points
A common error among traders involves being too engrossed into the action surrounding the breakout point on the chart, erroneously ignoring the larger picture and other parallel developments that could potentially hinder or support a breakout or a fakeout development.
Considering the broader picture involves studying nearby areas on the chart for potential short and long term support and resistance levels, trend lines or other aspects of technical analysis like pivot points of Fibonacci levels. It could also involve multi-time frame analysis to take not of any shorter or longer term developments on the chart at the interest points, including but not limited to candlestick and chart formations or the overall momentum and rhythm of the market.
We will look at a quick example to show how a seemingly solid breakout play does not evolve into a longer term trade because of another hurdle in close proximity.

Notice that we have a typical breakout scenario with the market tightening into a sideways consolidation phase, and breaking out to the downside in a conventional fashion (i.e. breakout plus retest to confirm former support turning into fresh resistance). However, sellers stopped dead in their tracks at a former support and resistance level that actually turned the market around. An informed trader who was aware not only of the breakout setup but the ongoing developments in the vicinity of the setup, would possibly have been less surprised to see what the market did here.
At this point, it is perhaps important to mention that throughout the article our emphasis on breakout setups has been via a very conventional sense: that is getting in the market following a breakout potentially to ride a longer term price move. Some of the setups identified above as mediocre breakout plays might still be valid trade setups for an aggressive breakout trader who perhaps does not shy away from taking shorter term scalping-style breakout trades. For instance, on our last example, the breakout setup might still have appealed to a breakout trader eyeing for the market to hit the labeled potential support area.
However, the point of the article was to distinguish between conventional breakout and fakeout scenarios using some common price action principles and phenomenon. In the end, none of these can serve a fool-proof methodology to accurately filter away all fake breakout situations from true breakouts. But, when combined with experience, added chart time and practice, these can be vital tools to potentially stay ahead of the game and analyze charts and possible trading opportunities in a proactive manner.
There is a substantial risk of loss in futures trading. Past performance is not indicative of future results.