This article on Market Reversals is the opinion of Optimus Futures.

- Historical support and resistance can help you anticipate potential market reversal points in a bear market.
- You can use several patterns on a longer-term scale to potentially anticipate the end of a bear market.
- Be sure to use fundamentals to support your technical thesis when trying to call a bear market bottom.
There’s this saying that one should never attempt to trade tops and bottoms. Arguably, calling tops is tricky, particularly if your market is at an all-time high. Calling bottoms is just as challenging, and a trader should use historical support levels as a guide. Correctly identifying either a top or bottom can be next to impossible and no tool or approach is guaranteed to work.
Fundamental analysis provides a strategic basis for financial trades but isn’t intended to specifically identify technical setups, namely, market entries and exits.
In other words, technical analysis is often mistakenly considered a tool only for short-term traders. It is our view that it should be considered alongside some form of technical analysis as well.
Using Technical Analysis to Spot Market Reversals
Technical analysis can provide hints about a potential market reversal of a bear and bull market much earlier than most fundamental and economic factors alone.
Some evidence for this claim can be observed in all major bear market reversals.
But for now, let’s take a look at the recent instance of COVID-19 bear market.
During the Covid Crash shown below in figure 1, the bottom occurred on the week starting 23rd March 2020. Many technical indications gave a hint that the 23rd March bar was the final capitulation point.
Here are a few of them…
Take a look at the completion of the downward movement on March 23.
On March 30, we see a bullish engulfing candle following the steep drop. This was just the first hint that a reversal may have started.
An engulfing candle is typically considered a strong indicator that directionally may change. In this case, we’re talking about a reversal from bearish to bullish.
The March 23 candle paints this picture, satisfying the condition behind this expectation.
So, the odds of a market reversal have already increased at the closing of the next candle ending on 6th April. As per this method the number of candles on either side can be increased to boost the importance of the trough.
In Figure 1, three candles on either side satisfy this method’s criteria, further increasing the conviction about the market reversal.
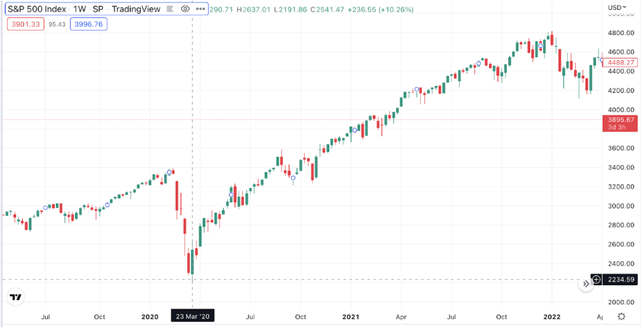
Figure 2 confirmed the higher bottom and higher top formation on 6th April 2020. At the same time, the RSI indicator crossed above the oversold level.
It then revealed a minor throwback, testing the oversold level again, finally bouncing back to continue its upward rise.
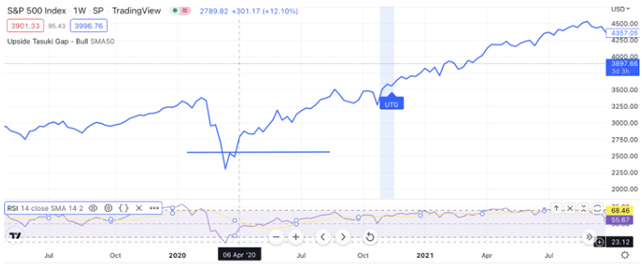
This pattern shown by the RSI confirms the reversal indicated by the higher bottom higher top formation visible on the price chart.
Now let’s see how the fundamental and macroeconomic indicators fared at identifying the market reversal.
Using Fundamental Analysis to Spot Market Reversals
Since the March 2020 bear market was caused due to COVID pandemic, the development of a COVID vaccine could have been taken as the beginning of the market reversal.
On 24 June 2020, China approved the CanSino vaccine, and on 11 August 2020, Russia announced the approval of its Sputnik V vaccine for emergency use.
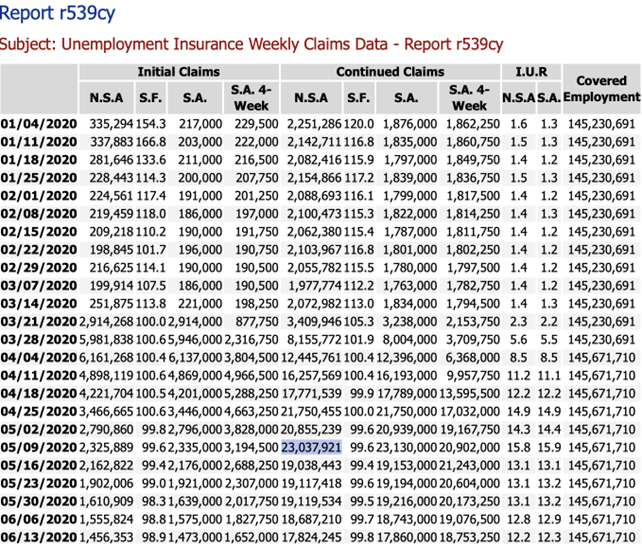
In the unemployment Insurance weekly claims data published by the US Dept of labor ( see table below), a high-frequency indicator peaked on 9th May. Still, an observer of this data would have taken a few more weeks to realize that the peak occurred on 9th May.
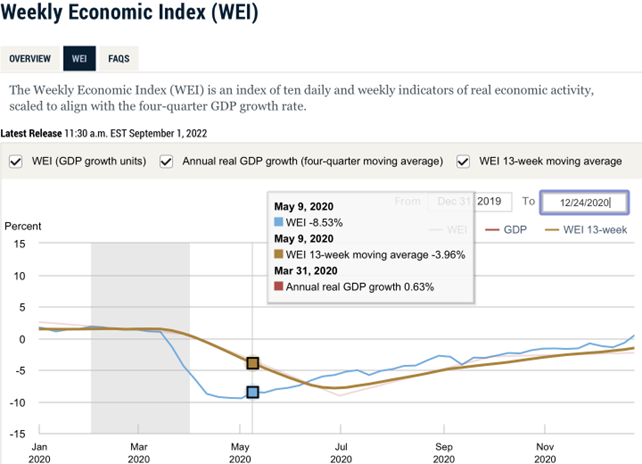
The WEI, a high-frequency indicator comprising of 10 indicators of real economic activity, is published by the Federal Reserve of New York. This indicator showed the first signs of recovery only on 9th May.
Thus we can see that the multiple technical indicators indicated the reversal in the first half of April at least one month earlier than the first hints of a market reversal were given by the fundamental and macroeconomic indicators.
The Bottom Line
People often complain that predicting the transition from a bear to a bull market is extremely difficult, if not entirely impossible. Difficult, yes, but you can stack the probabilities potentially on your side if you follow both the fundamentals and technicals.
One solution would be to use higher time period charts. We have used weekly charts in our analysis, which has saved us from the kind of market noise you would get on a daily chart.
Still, there are more fundamental and technical tools you can use to help identify these major market reversal points. What we covered above are just a few techniques among many. Calling potential reversals is as much an art as it is a science.
It requires lots of studying and experience to develop the necessary skills to get it right most of the time.
If you’re interested in learning more about how bull markets end and bear markets start, be sure to check out our article here.
There is a substantial risk of loss in futures trading. Past performance is not indicative of future results. Charting presentations and scenarios are presented as examples only and were prepared with the benefit of hindsight.