This article on Engulfing Candlestick Patterns is the opinion of Optimus Futures.
The engulfing candlestick pattern is a very popular candlestick pattern among technical traders and price action enthusiast. Engulfing candlestick patterns can be authoritative and often highly indicative of changing market sentiment which is why it attracts a lot of interest from traders with all kinds of varying trading approaches and methods. While it is easier to spot this candlestick pattern than most, newer traders are often too engrossed in trying to learn how to trade them, rather than where. In this article, we address both aspects.
Engulfing Candlestick Patterns
An engulfing candlestick pattern is formed when price action over a specific period of time exceeds the range (the high and low) of the previous trading period. With candlestick charts, this phenomenon appears as a candlestick that has a high and low exceeding the high and low of the previous candlestick.
Let’s look at a bullish and a bearish engulfing pattern in real time for a visual understanding:

Highlighted above is a bullish engulfing chart pattern. You can see that the specified candle has a close higher than the open, that it is bullish in nature, but it also has a low and a high that exceeds the prior candlestick.
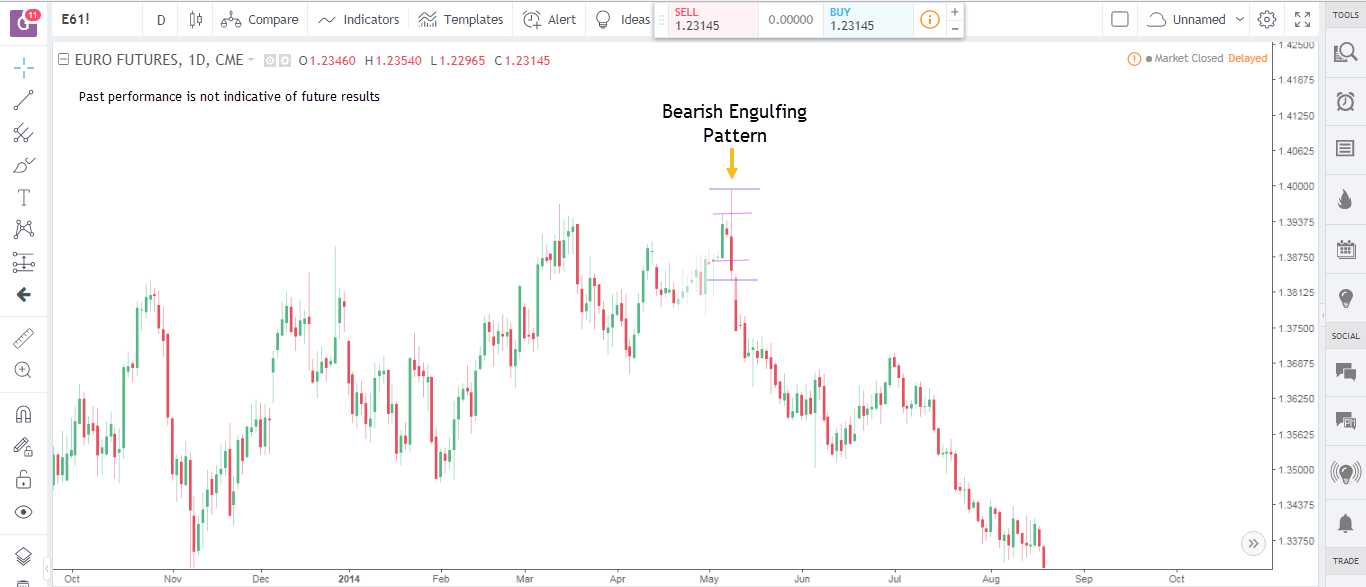
Here we have a bearish engulfing candlestick pattern. Notice that it is a bearish candlestick with a close lower than the open and also a high and a low that exceeds the prior bar.
Good vs Bad Engulfing Candlestick Patterns
In the above example primarily, you will also note that the bearish engulfing pattern actually ‘engulfs’ more than one candlestick. While technically an engulfing pattern is valid if the considered candlestick has a range larger than the immediately previous candlestick, the engulfing pattern is generally considered stronger when it engulfs more than one candlestick.
There are also some general considerations that you may want to look out for in order to differentiate the better looking engulfing candlestick patterns from an average or below average ones. A bullish engulfing candlestick with a larger wick to the downside – as you would expect with a bullish pin bar for example – can often be a sign tilting in favor of the pattern’s strength. Vice versa, the same would hold true in the case of a bearish engulfing pattern, where you would prefer to see a larger wick to the upside – reminiscent of a bearish pin bar. The examples illustrated above both point to engulfing patterns with this characteristic.
An engulfing pattern is also considered stronger when the body of the candlestick itself is also large and authoritative. The body is the colored part of the candlestick or the distance between the open and the close of the candlestick. This is in sharp contrast to this pattern’s close cousin the pin bar, for which we usually prefer a large wick relative to a small body. However, with the engulfing pattern, the larger body gives the pattern a more authoritative appearance that is often needed to confirm high probability trade setups.
In the above examples, you will also note that we point the bullish engulfing pattern at a swing low and the bearish engulfing pattern at a swing high. Like the pin bar, the engulfing pattern is also usually a trend change indicator and is best located at swing points. A bearish engulfing pattern at a swing low will generally be a weaker signal than a bearish engulfing pattern at a swing high. This is not to say that engulfing patterns are not good trend continuation signals. While they are actually most effective as trend reversal signals, they can also be quite effective deep into pullbacks coming from dominant trends – as a valid trend continuation signal.

In the chart above we have pointed two bullish engulfing patterns that work as trend continuation signals. You will see they both represent minor non-threatening pullbacks into the uptrend that are normal and usually needed for healthier long-term trends.
The second (higher) bullish engulfing pattern is specifically a strong trend continuation signal because not only does it format the trough of a deeper pullback, it also comes off a former resistance zone that is showing signs of flipping into support. And that brings us to a very important point.
Looking for Engulfing Patterns that form AT Support and Resistance
The heading to this action really says it all. Ideally, we want our engulfing patterns to form at key horizontal support and resistance levels and other areas of interest like round numbers and long-term moving averages. The larger the number of factors in confluence at the point where the engulfing pattern forms, the stronger the setup in terms of location.
Remember, we started our discussion saying how newer traders often skip the location aspects and are too keen on just spotting the large and authoritative engulfing pattern as a viable trade signal. We’ll see now how that can be detrimental to your ability to trade the engulfing pattern effectively in the long term.

Consider this strong looking bearish engulfing pattern. We stay ‘strong looking’ because it has all the characteristics – visually – to make it so. We have a large wick to the upside, and a larger authoritative body size as well. But if you have been following this post keenly over the last two sections you should immediately see the problem with this setup.
For one, we have the bearish engulfing pattern at a swing low when ideally they are more effective at swing highs. Secondly, instead of coming off of a major support and resistance level it is actually heading straight into one. For the price to find support right under the bearish engulfing pattern should not come as a surprise to a well-informed technical trader who is paying attention to key support and resistance levels in the vicinity.
Let’s look at another example that gives more weight to the heading to what we just discussed:

Here is a bullish engulfing pattern that is actually at a swing low and is AT a former resistance level rather than heading into one. You will also note that the same resistance level also falls in confluence with the 1900 round number. No surprise at all why that engulfing pattern worked out really well.
How to Trade Engulfing Candlestick Patterns
There are typically many ways technical traders choose to trade engulfing candlestick patterns, ranging from ultra-aggressive to ultra-conservative.
The most common approach – and also the most conservative – is to wait for the engulfing pattern to ‘break’. That is to wait for the price to venture a few ticks beyond the high of a bullish engulfing pattern, and the low of a bearish engulfing pattern. The buffer allows for an additional confirmation that price does indeed want to travel in the direction proposed by the engulfing pattern itself. The stop loss for this conservative style goes a few ticks above the opposite end of the engulfing pattern. That is, a few ticks above the high of a bearish engulfing pattern and a few ticks below the low of the bullish engulfing pattern.
Stop-loss disclaimer: The placement of contingent orders by you or broker, or trading advisor, such as a “stop-loss” or “stop-limit” order, will not necessarily limit your losses to the intended amounts, since market conditions may make it impossible to execute such orders
More aggressive approaches call for taking trades at a pullback into the engulfing pattern or tightening the stop loss to a point perhaps within the range of the engulfing pattern for a more favorable risk: reward on the trade.
It is also perfectly acceptable to use varying trading approaches for engulfing patterns depending on market conditions and the overall strength of the setup, although a more subjective trading approach is usually best reserved for experienced traders who can manage their emotions better than newer traders.
Ideally, it would favor the experienced trader to perhaps using a more conservative trading plan for an imperfect setup that he or she chooses to trade anyway based on experience and possibly some factors that go heavily in favor of the anticipated market move. A more aggressive style may be reserved for the ‘A grade’ setups that have all of the foundations of strength discussed above. Newer traders, on the other hand, are best of using the conservative approach at all times, until experience dictates better.
There is a substantial risk of loss in futures trading. Past performance is not indicative of future results.