Indicators are very popular and almost all traders use, or have used, some sort of indicator before. At the same time, the vast majority of traders don’t really understand what their indicators tell them and how to use indicators effectively. This goes so far that traders have been passing on inaccurate information about indicators for years and even decades. If you want to be successful in the trading business it is essential to have a very deep understanding of the tools you use to make your trading decisions.
In this article we explore the myth of the overbought and oversold indicator reading and why misinterpretations can lead to false trading decisions.
An introduction to overbought and oversold
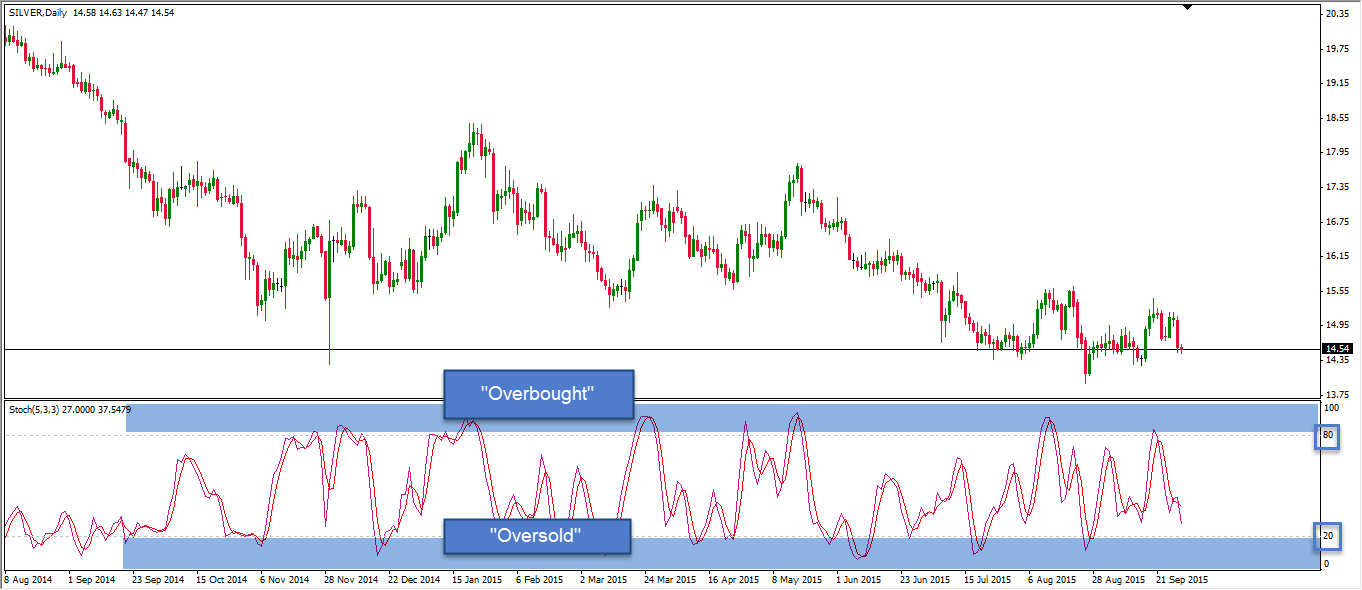
Overbought and oversold readings can be found on almost all oscillator indicators. The most common ones are the STOCHASTIC, the RSI and the CCI. People call a scenario overbought when the oscillator reaches high values (typically 70 or 80). Conversely, traders call a price scenario oversold when the oscillator dips below a certain value (usually 30 or 20).
The belief is that an overbought indicator reading suggests that price has been going up for too long or too fast and that a reversal is imminent because a strong rally is not sustainable for a long period of time. On the other hand, traders believe that an oversold oscillator indicates that price has been moving lower for too long and that a reversal to the upside is going to happen. In the next point we show you why such an interpretation can be very misleading.
Understanding your STOCHASTIC indicator
Indicators are tools which apply a specific mathematical formula to the price movements you can see on your charts. We don’t want to get too technical at this point and just briefly summarize what the STOCHASTIC indicator does because it is a very commonly used indicator.
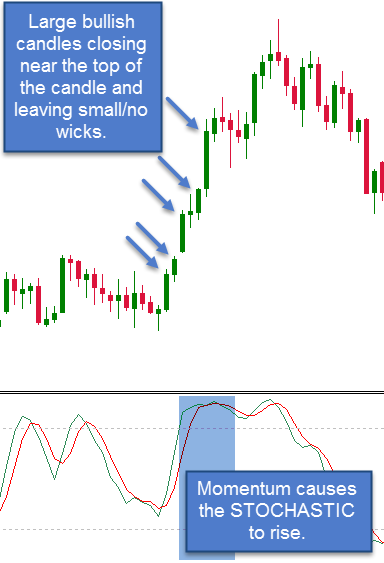
The Stochastic indicator measures the size of your price candles/bars and analyzes the close of a candlestick. If, during an uptrend, price closes at the top of the candle and does not leave a wick, the STOCHASTIC value rises. Thus, a rising STOCHASTIC indicator value tells you that price has been moving higher and that the price closes near the top of the candle – signaling rising bullish momentum.
What is overbought really?
Thus far you have learned how price movements influence the STOCHASTIC indicator values and what it means when the STOCHASTIC values rise. Now you will be able to quickly see why the general understanding of overbought is not entirely correct.
A STOCHASTIC value of 80 or higher means that price has been moving higher significantly and that price closes near the top of the candlesticks. Thus, both things suggest a very bullish environment and strong momentum to the upside. The STOCHASTIC formula does not include a component that focuses on reversals – it is a pure momentum indicator.
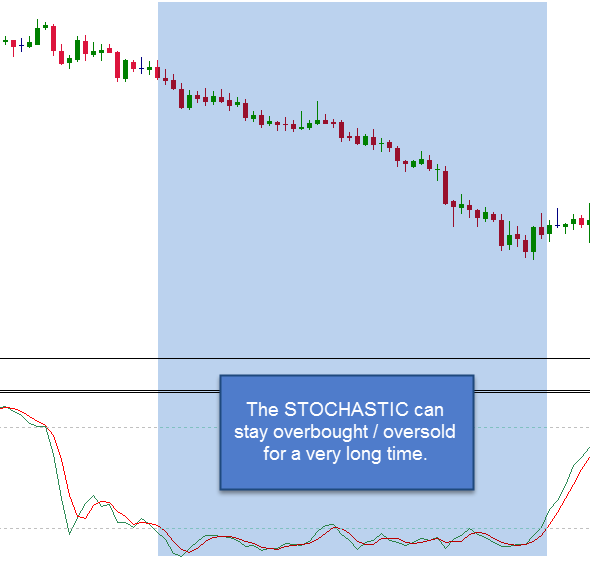
Fixed mindset when thinking in fixed terms A wrong understanding and a false interpretation of the STOCHASTIC indicator can put traders into a mindset where they are constantly looking for trades into the opposite direction of the current trend. Instead of following the trend, which the STOCHASTIC actually signals, traders keep looking for counter-trend trades and miss potential profitable trading opportunities.
It is therefore important to really understand what your trading tools are telling you. Inconsistent trading results are often just the result of a lack of understanding and can be avoided.
When to use the STOCHASTIC and how
After we have discovered what the STOCHASTIC does not do, we can now take a look at how to use the indicator in your trading. There are 3 main ways the STOCHASTIC indicator can be used:
1. Trend following
Although this is not the real purpose, the STOCHASTIC indicator does provide information about the strength of a trend. In an uptrend, rising/high STOCHASTIC values confirm high momentum. High STOCHASTIC values suggest the existence of a strong trend and should not be mistakes for an ‘overbought’ scenario.
2. Turning points in a range environment
In a range-bound market, with very precise and clearly defined boundaries, the STOCHASTIC could provide clues about turning price. If price reaches the upper boundary of a range and the candles get smaller and start closing lower, the STOCHASTIC indicator will also turn.
3. Divergences and the hidden loss of momentum
A divergence exists when price makes a higher high and the STOCHASTIC does not make a higher high. A STOCHASTIC that fails to make a new high signals the loss of momentum. The new price high is not confirmed by momentum and the bullish force behind the price move is not signaling strength.
This article has two goals. First, it explains what the STOCHASTIC indicator really does, how it analyzes price and then manifests on your charts. But the real take away message should be the importance of developing a better understanding of your trading tools. If you are using indicators or other principles to make trading decisions, it is essential to fully understand what they are doing. Blindly following signals and other trader’s instructions often leads to incorrect assumptions and false interpretations.
There is a substantial risk of loss in futures trading. Past performance is not indicative of future results.

