Double tops and bottoms are patterns that can be drawn in many variations and every trader can potentially interpret them in ways that are applicable to their own style of trading. However, there are certain basic patterns that can help traders establish support and resistance lines more logically versus random drawings.
The three types of double top patterns
Before we get into actual chart studies, we have to address the different types of double tops and what they mean for traders.
The first double top on the far left is the classic double top. This is what you usually see in trading literature or on other trading websites. However, this pattern where you have two swing highs at the same level are rare and trading from a mindset where double tops must look like this can lead to many problems. Also, when you go through a chart you won’t see all the failed double tops as easily because they don’t stand out as much which is very misleading and it can make trading double tops seem too easy.
The second pattern is what often happens around a previous swing high and instead of seeing the textbook reversal which would be obvious and relatively easy to trade, price often forms a fake breakout which makes it look like price is going to trade higher. After traders are misled to believe that the trend is continuing higher, price falls back below the previous swing high and creates the double top. You will see other sites or books refer to such a pattern with Fakey, Squeeze, Trap or similar terms.
The third pattern is a continuation of the previous one and it highlights the imperfection of chart analysis and setups. A trader without a precise approach can easily fall victim to whipsaw price action around such key areas. We will come back to this point later but it’s important that you are clear about your approach; are you a breakout or a double top trader? Trying to trade two opposite systems can easily lead to problems.
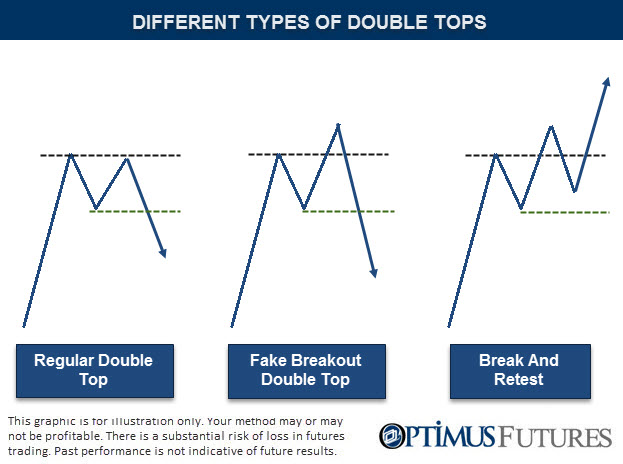
Chart studies and trading tools
Pending vs. Market orders
After we are clear what to look for in a double top or bottom, we can take a look at a few chart studies and explore how price behaves around double tops in real time trading.
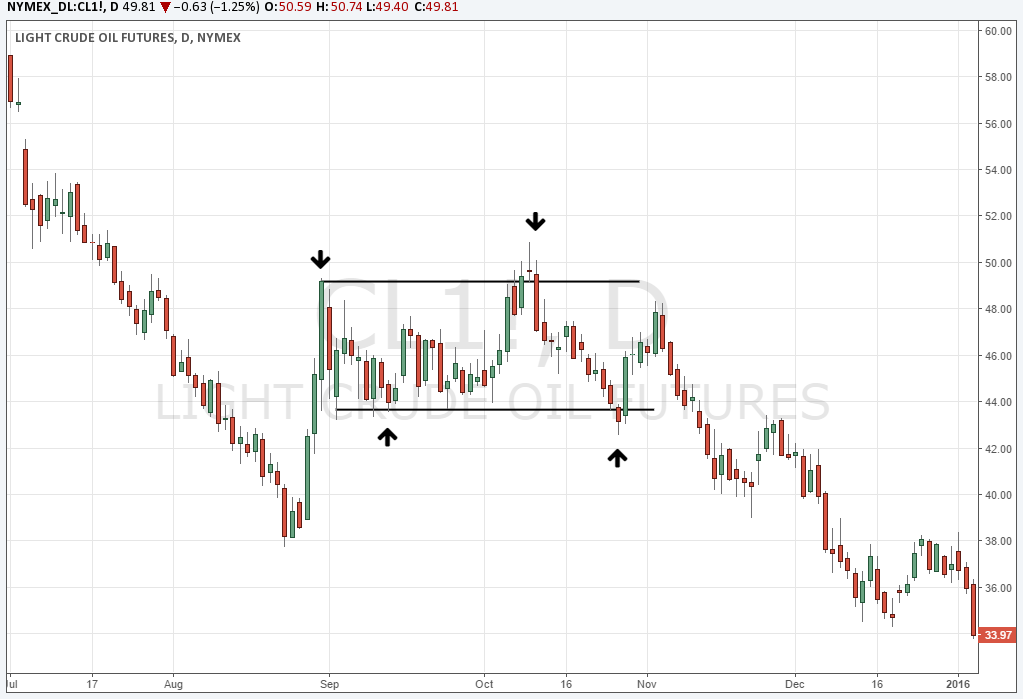
At first glance, you can see that price rarely respects those previous swing highs and lows precisely and a violation of such a price level almost always happens. Thus, if you trade double tops and bottoms, it is not recommended to trade such levels blindly using pending orders. Waiting for price to fall back below/above the level can, potentially, improve the quality of such signals.
Bollinger Bands and other tools
Of course, a trader can also add indicators or charting tools to analyze price action around double tops and bottoms. Bollinger Bands are a popular tool which allows traders to analyze volatility easily.
A double top or double bottom that happens with a spike through the Bollinger Bands can, potentially, improve the signal even further. The stronger the spike and the following reversal, the higher the likelihood that the double top/bottom will hold.
The Fakeout pattern
Because the fakeout patterns are so common and they often cause traders to misinterpret the price action on their charts, we want to go over 2 examples and explain how to approach such a setup.
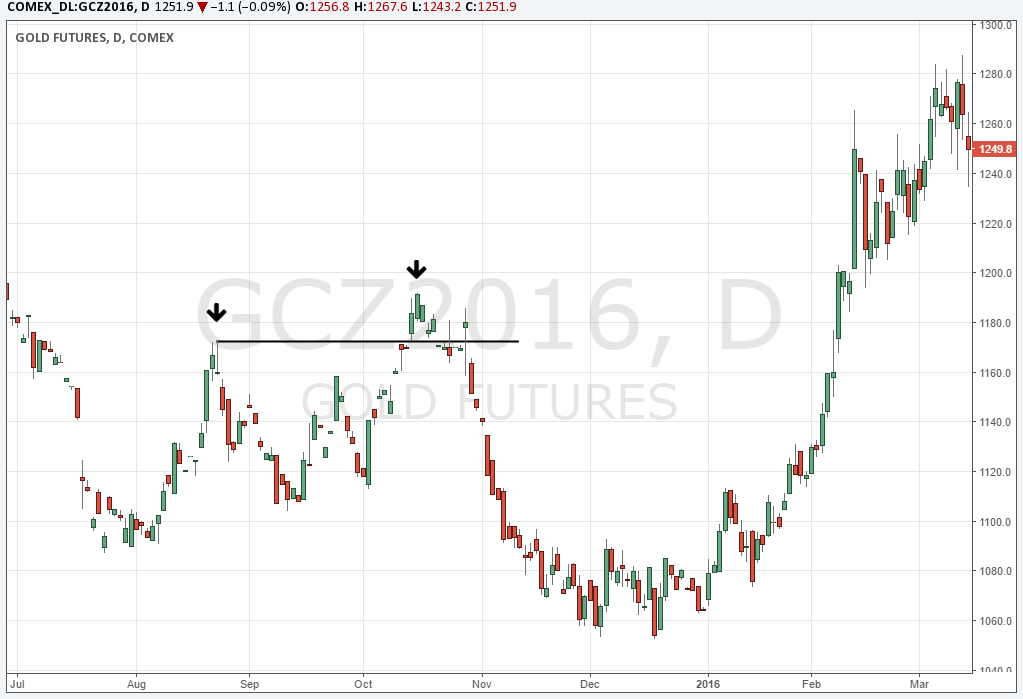
Gold continuously traded back into 1170 and before it broke the level on the second attempt, it gapped higher into the level. It afterwards broke above it and even traded higher 2 days in a row. Price then fell back below the level and immediately gapped higher again. This price action suggested strength but shortly after price sold off quickly with large gaps and long bearish candles.
This highlights two important aspects about double tops: first, always wait until price has moved lower, away from the double top before entering. Second, if you are double top trader, don’t simultaneously try to be a breakout trader. Following two strategies that are opposite to each other can create a lot of mental conflicts.
Tricked by strength
The chart below shows a popular example of recent trading history. The S&P was trading at the highs at 2050 and a lot of talk about a potential market collapse and a bear market were going around. Sure enough, price started to fall and within just 2 trading days, price erased months’ worth of gains. It looked like the S&P500 was tumbling but traders looking for a double bottom and an opportunity to get in long for a good price saw the quick reversal over the next 2 days which then lead the S&P into new all-time highs.
The most important concept when it comes to trading double tops and bottoms is it to wait patiently until price reverses back and confirms that the level is holding. Being too early and trying to predict a reversal can be dangerous when levels don’t hold and price doesn’t come back.

There is a substantial risk of loss in futures trading. Past performance is not indicative of future results.