
This article on Trading Candlestick Patterns is the opinion of Optimus Futures.

While candlestick patterns are usually found at the center of many technical trading methodologies as reliable entry triggers or trade management tools, they can also be used in many unconventional ways that traders may not be very familiar with, but are nevertheless very effective.
One such method deals with trading candlestick patterns as they form away from the main source location and trading them as an afterthought to unfolding market action.
Understanding Candlestick Patterns
To get a better grip of the methodology we briefly discussed above, it is first important to understand candlestick patterns and formations from a perspective slightly different to what is usually used when traders initially learn and start using them in their day to day trading.
A pin bar for example is usually touted as a strong setup when it appears at swing points. That is, traders usually like to see pin bars at extreme highs and lows on their chart. The same goes with some other candlestick patterns that pack the potential to reverse trends and market sentiment, like the engulfing candlestick pattern.
However, as we dissect these candlestick patterns, it becomes increasingly evident that the primary reason they work and traders refer to them when analyzing potential trading opportunities is that they represent a shift in market momentum for that period of trading activity.
Regardless of where a pin bar forms, it shows the reversal of momentum that was initially dominant in the first part of that trading period. Obviously at the top an uptrend it is no surprise why a bearish pin bar (with a wick protruding to the upside) would point to that shifting momentum towards the possibility of a reversal.
But as we understand the pin bar for what it truly is, does that make the pin bar a tradable candlestick pattern only at swing points, or can we use the inherent information that a pin bar carries to validate other aspects of price action too? And of course, we refer to the pin bar pattern only as an example because it is likely the most popular candlestick pattern out there. The argument could easily revolve around potentially all the other major candlestick patterns too, that are often perhaps mistakenly traded in very precise market conditions only.
Trading Candlestick Patterns as Confirmations Rather than Triggers
Have you ever regretfully skipped trading a candlestick pattern because it did not print at the source itself, say for example at a key support and resistance level, even though price evidentially did bounce off that level exactly as you had anticipated?
Technical traders often consider candlestick patterns as either triggers to their trades or potential indicators to exiting a trade. Since these traders are chasing the glory of finding an entry at the source – they are usually only interested in locating these candlestick patterns at the source, and consider the ones printing afterwards as perhaps weak and untradeable. We are here to tell you that that may not be the right approach.
Candlestick patterns – sometimes even as an afterthought to a highly anticipated market event – can be just as reliable, if not more.
Let’s consider a few examples:

In the chart above, we point out two candlestick patterns. The first is a bearish pin bar at a swing high –exactly where they are typically expected to be most useful at. The other is a bearish engulfing pattern that forms slightly lower than the bearish pin bar and has a high that does not protrude far enough into the resistance we are looking at.
Going by the book, the bearish engulfing pattern should be a lower probability setup than the bearish pin bar, but when you consider price action holistically, the bearish engulfing pattern should pop out as a legitimate tradable trigger.
Ideally, we want to see resistance coming in at the marked pale pink area on the chart above. We have indications of that first as the bearish pin bar appears. However, we notice that instead of price dropping sharply, we have multiple retests of resistance that appear nonthreatening as we don’t see a sharp close above the resistance level. Then, as a late afterthought, we see the market print a bearish engulfing candlestick pattern. Given what we know about the bearish properties of this candlestick pattern, clearly the pattern worked as just another added confirmation of the level marked above holding as resistance?
Notably, if the bearish engulfing pattern had appeared in place of the bearish pin bar, instead of following up on all the already existing evidence of price finding resistance at the level, it may not have been the strongest looking engulfing pattern. However, as we just elaborated, when looking at the broader picture, the bearish engulfing pattern does hold its own merit.

Here we look at a bullish pin bar that is not at a swing low at all. However, it does form at a second pullback to a critical support and resistance level that acts like a second confirmation of price finding legitimate support at the area marked in pale pink above.

Here we have another similar example. We have a bullish engulfing candlestick pattern present itself at the source – that is at a swing low at a critical support level. As price bounces off the support level, we have it piercing through an important horizontal resistance and support level as marked. For price to continue north, a trader should ideally expect the level to then hold as support to allow price to propel further north. As price pulls back, we have a bullish pin bar off that same level.
It may be categorized as a weak setup by some traders given that it is near to a swing high rather than a swing low where traders are typically looking for them. However, because we have a bullish pin bar at a spot on the chart where we would typically expect bullish activity anyway, the pin bar yields itself as a fair play.
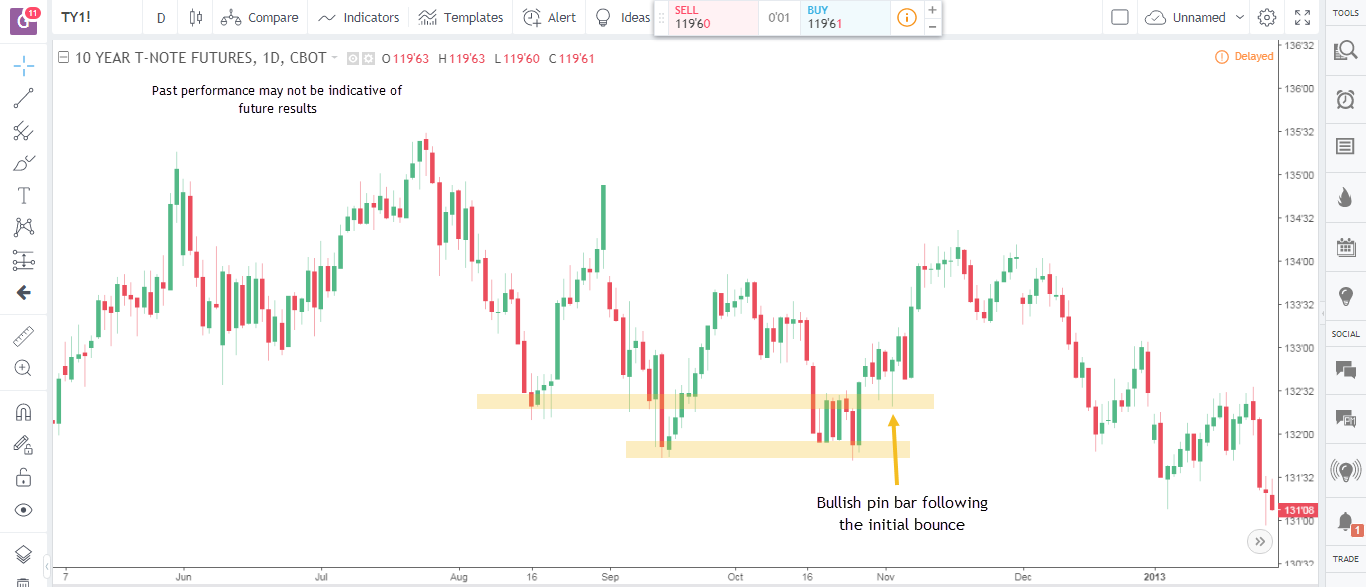
On this occasion we have price bouncing off a support level without a valid trigger from a candlestick pattern at all. However, as price makes a move up, we see a quick pullback to another mid-range support and resistance level that yields a bullish pin bar that acts as a confirmation of the level holding as support. Once again, the pin bar does not appear to be at major swing low, but agrees with the general anticipation that a trader following this market would have, after seeing price pullback to a support and resistance level.
For a technical trader who understands market dynamics and price behavior around support and resistance levels, trading candlestick patterns is often not just an objective, but more of an opportunity to improvise where and when they line up with broader market sentiment and their inherent indications agree with repetitive market phenomenon.
We still suggest that newer traders who may still be on rear end of their learning curve when it comes to understanding market dynamics and price behavior, should still be looking for bold candlestick patterns at conventional locations, and only attempt to trade them at unorthodox locations only when they are confident of their price action reading skills.
There is a substantial risk of loss in futures trading. Past performance is not indicative of future results.


