When it comes to evaluating the past performance of automated trading strategies, traders often just glance at an equity curve and then choose the one that has risen to the highest levels. Such a shallow evaluation may often leads to wrong assumptions once a trader has opted-in on a trading strategy and then faces periods of drawdowns.
There are certain performance statistics which may allow you to shed more light on the performance of a trading strategy. By looking at additional professional performance metrics, a trader is able to choose the automated trading strategy that fits his needs and his risk profile (the level of risk he is willing to accept) with an added perspective.
There is a risk of loss in futures trading. Past performance is not indicative of future results.
Why percentages are not enough to evaluate an automated strategy
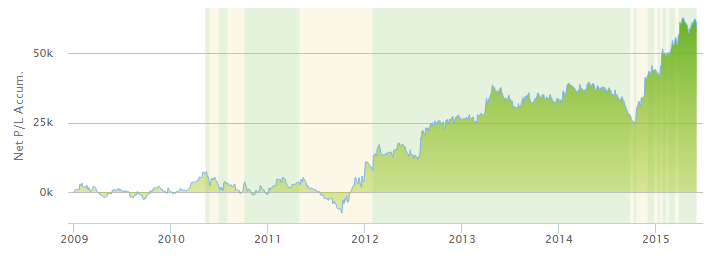
Take a look at the two following equity curves of two different automated trading strategies. Both strategies have realized a very positive return and both have the exact same annual ROI of 20.5%, but as you can see at first glance, how these two strategies achieved their returns is very different.
Measuring performance in percentages alone can be very misleading because it underestimates the significance, the size and the duration of drawdowns. Especially when it comes to evaluating automated trading strategies, it is important to correctly estimate the significance of possible drawdowns, to make the right decision for your personal risk profile.


Sharpe Ratio – Considering risk and returns
The Sharpe ratio is among the most commonly used performance measurements and the advantage of the Sharpe ratio is that it analyzes the risk of a realized return. Here are two things you need to know when it comes to understanding the Sharpe ratio:
1) The higher a Sharpe ratio of a trading strategy, the better is the return an investor can expect to realize in relation to the possible risk.
2) When comparing two trading strategies with the same return, the one with the higher Sharpe ratio has had less volatility in the past.
When we come back to our initial example, we now understand that, although both automated trading strategies have the exact same annual ROI (20.5% return), the second one has a much lower Sharpe ratio because the drawdowns are much more significant and frequent, whereas the growth of the first strategy is very stable and steady.


All graphs and performance figures are for illustration only. There is a substantial risk of loss in futures trading. Past performance is not indicative of future results.
Furthermore, if you compare two trading strategies with different returns, a more conservative and risk averse investor should think about choosing the one with a higher Sharpe ratio, even when the past return is smaller, to avoid impulsive and emotionally caused decisions when dealing with drawdowns.
Sortino Ratio – Downside risk
The Sortino ratio is an advancement of the Sharpe ratio. The Sharpe ratio penalizes both, unusually high positive and unusually high negative return equal. The Sortino ratio looks at risk and volatility differently. It only penalizes downside risk (volatility), which means that when a trading strategy realizes exceptionally high positive returns, the Sortino ratio does not penalize the trading strategy.
The two graphs below illustrate the difference between Sharpe and Sortino. The performance of the first strategy is higher (21% vs. 17%) and the Sharpe ratios are almost identical (1.1 vs. 1.18). The significant difference is the Sortino ratio, which is twice as high for the second equity curve, which means that the second trading strategy has much more stable returns and less downside volatility.
This also becomes clear when looking at the charts: although the first trading strategy has periods of exceptionally good runs, you can see frequent and, partially, significant drawdowns. The second strategy, on the other hand, also realized positive returns, but the drawdowns were much smaller and less frequent which the Sortion ratio acknowledges and rewards, hence the high Sortino ratio.
Especially for risk-averse investors, paying close attention to the Sortino ratio can help you make better judgments when deciding which automated trading strategy to follow.


Sterling Ratio – Taking drawdowns into account
The Sterling ratio, similar to the Sortino ratio, also arose from the critique of the Sharpe ratio, that only downside risk should be penalized. In contrast to the previously described ratios, the Sterling ratio compares the annual return to the average annual drawdown. Therefore, investors who have difficulties dealing with frequent drawdowns should also have a look at the Sterling ratio to find their optimal automated trading strategy.
MAR Ratio – Largest drawdown
The MAR ratio is an alternative to the Sterling ratio. Whereas the Sterling ratio uses the average annual drawdown, the MAR ratio takes the average return and then divides it by the maximum drawdown which had been observed over the whole investment horizon.
The following two graphics illustrate the difference between the Sterling ratio and the MAR ratio. Both strategies have a very similar annual ROI (30% vs. 27%) and their Sterling ratios are almost identical (1.3 vs. 1.4) as well, but the MAR ratio of the first automated trading strategy is three times as high as the one from the second strategy. This means that, although the annual ROI and the annual drawdowns are similar, the largest drawdowns of the two trading strategies differ significantly. Being able to interpret this ratio can help risk-averse investors to filter potential trading strategies even more effectively.


All graphs and performance figures are for illustration only. There is a substantial risk of loss in futures trading. Past performance is not indicative of future results.
Chose the correct ratio for your investment objectives
As you can see, there are numerous metrics that can be used to analyze the performance and the risk of realized returns of automated trading strategies. Knowing which one to use for your personal objectives is very important and enables you to make better judgments about the investments that you are considering and can also help you to find investments that fit your personal level of risk taking much better.
Optimus will help you find the automated system that best fits your specific needs, taking into account your overall investment objectives, your risk tolerance, your trading time horizon, and the amount of risk capital you can invest. If you need to speak with someone who can help you make this choice, call us toll-free at 1.800.771.6748.
Please be advised that trading futures and options involves substantial risk of loss and is not suitable for all investors. Past performance is not necessarily indicative of future results. This matter is intended as a solicitation to trade.


