The article on How To Trade Order Flow On Tradingview is the opinion of Optimus Futures, LLC.

TradingView has become a go-to platform for many futures traders, especially those who trade off price action, support, and resistance lines and make decisions based on technical analysis.
Whether you’re trading treasury futures, crude oil, gold, or indices like the E-Mini S&P 500, having an eagle view of the market is essential.
One way TradingView can help futures trading is through its Volume Profile feature.
It’s not built directly into TradingView, but it’s available and can add an extra dimension to your decision-making process.
We’ll show you how to tap into the Volume Profile on TradingView and how it can be used in your futures trading.
In addition, we’ll introduce you to another tool that can potentially improve your futures trading analysis.
What is Volume Profile?
At its core, Volume Profile is a sophisticated charting tool that showcases trading activity over a designated period at specific price levels.
Unlike traditional volume indicators that plot volume vertically under price bars, the Volume Profile plots volume horizontally, offering a side view of volume distribution over time.
Here are the key terms and areas to pay attention to on a volume profile chart:
High Volume Nodes (HVN): Areas where significant trading has occurred. These areas can indicate strong support or resistance levels, showing where the market found fair value.
Low Volume Nodes (LVN): Points where trading volume is scarce. These areas can indicate potential breakout or breakdown points, reflecting price levels perceived as overvalued or undervalued by the market.
Incorporating Volume Profile in Futures Trading
- Identifying Key Trading Levels: Futures traders can utilize Volume Profiles to pinpoint high and low liquidity areas. High Volume Nodes (HVN) can indicate potential consolidation areas, whereas Low Volume Nodes (LVN) can be considered potential breakout or breakdown points. For instance, if the E-Mini S&P 500 shows strong volume accumulation at a particular price point, this can be viewed as a major support or resistance level.
- Spotting Imbalances: The Volume Profile can highlight discrepancies between buying and selling pressure, which is crucial for futures traders to gauge potential trend reversals or continuation. For instance, if gold futures exhibit higher buying volume at a specific price, it can indicate bullish sentiment, signaling potential upward price movement.
- Validating Breakouts: A breakout in crude oil prices, without substantial volume support, might be deceptive. Using the Volume Profile, traders can validate if breakouts or breakdowns are backed by significant volume, ensuring more informed trading decisions.
Harnessing Community Scripts on TradingView
While TradingView doesn’t natively offer the Volume Profile, it’s accessible through custom indicators developed by the community. Notable indicators include:
Footprint Classic by Investor_R: This divides the volume data of candles into Up volume and Down volume, echoing the Volume Profile’s approach.
Footprint by MarketWhisperer: A real-time analysis of order flow data, this assists traders in pinpointing potential entry and exit points in futures contracts.
To use these indicators:
- Navigate to the “Indicators” tab on TradingView.
- Search for the desired custom indicator.

- Apply the indicator to your chart and modify settings as required.

Note: Its generally easier to read footprint charts using a bar chart instead of a candlestick chart.
To learn more about Volume Profile, watch our video tutorial on Unlocking Market Insights with Volume Profile Trading.
Going Beyond Volume Profile
Volume Profile is a remarkable tool that pinpoints where most trading activity has occurred, helping traders identify potential areas of support, resistance, and value.
However, Footprints is arguably an even better real-time tool for futures traders.
What are Footprints?
Footprints offer a microscopic view of market activity, delving into the finer details of intra-bar data. They reveal the volume, trade size, and order flow dynamics within individual bars or candles.
Instead of just understanding where the trading activity happened, as with Volume Profile, Footprints allow traders to see the “how” and “why” behind the price movements.
They provide real-time insights, displaying numbers and colors within bars that denote aggressive buying, selling, and potential order imbalances.
How Do Footprints Differ from Volume Profile?
While Volume Profile showcases a histogram highlighting traded volume at distinct price levels, Footprints give a detailed breakdown of buying and selling activity within each candlestick.
This means that whereas Volume Profile may help identify broader areas of trading interest, Footprints will tell the story of aggressive buyers or sellers dominating specific price points. They unveil the nuances of order flow, showcasing real-time battles between buyers and sellers.
Why Might Futures Traders Prefer Footprints?
Futures markets, with their rapid movements and high leverage, demand a more immediate understanding of market dynamics. Here’s why Footprints can be especially beneficial for futures traders:
- Real-Time Decision Making: With the granular data provided by Footprints, traders can make informed decisions on the fly, which is crucial for markets like crude oil or E-Mini S&P 500, which can exhibit swift price changes.
- Gauge Player Behavior: Footprints allow traders to gauge the behavior of other participants, helping them anticipate potential price directions based on observed order flow dynamics.
- Spotting Trend Reversals: By spotting areas where aggressive buying or selling starts to wane, traders can anticipate potential trend reversals, a vital insight for short-term trading strategies.
- Deep Dive Into Order Flow: For futures traders, understanding the intricacies of order flow can be the difference between a successful trade and a missed opportunity. Footprints offer this depth, revealing where aggressive orders are pushing the market.
While Volume Profile offers an invaluable birds-eye view of market activity, Footprints dives into the nitty-gritty, potentially giving traders the nuanced insights they need to stay ahead in the futures market.
If you aim for that competitive edge, understanding Footprints might be your secret weapon.
Watch this video to learn how Footprint Charts (known as Cluster Charts on the Optimus Flow platform) are a powerful order flow tool that allows you to see every transaction at every tick level within each candle.
How To Gain Access To Footprints
TradingView doesn’t offer Footprints yet, but you don’t have to wait for them.
In fact, you can gain access to Footprint charts via the Optimus Flow trading platform.
Here’s how:
- Open a New Chart: Click on the ‘Cht’ icon in the quick access row at the top left, or click on the Optimus Flow logo to open the dropdown where you can also access a new chart window.

- Access the Volume Analysis Toolbar: Right-click anywhere on the chart to open a dialog box. Navigate to Volume Analysis. This will allow you to access the footprint chart which is labeled ‘Cluster’. However, you can also select Show toolbar. This will open the toolbar at the bottom where you can select the ‘Cluster’ option.

- Select the footprint type you want from single, double, or imbalance. Once you’ve made your selection, the chart will update with the relevant information.

You can learn more about footprint chart settings and uses on Optimus Flow in this article HERE.
But that’s not all you can do with our platform.
Here’s what else it has to offer:
The Optimus Flow Advantage
Optimus Flow helps futures traders streamline their decision-making process with tools like:
DOM Surface: This feature allows traders to monitor every shift in liquidity within the order book. Additionally, they can scrutinize the trading activities of participants through a Heatmap view, providing an in-depth perspective of market movements.
Volume Analysis: With tools designed for profound price analysis, traders can employ the Cluster chart, Volume profiles, Time statistics, Time histogram, Historical Time & Sales, Price statistics, and the Volume Impact indicator. These span tools give traders a comprehensive price and volume interplay breakdown.
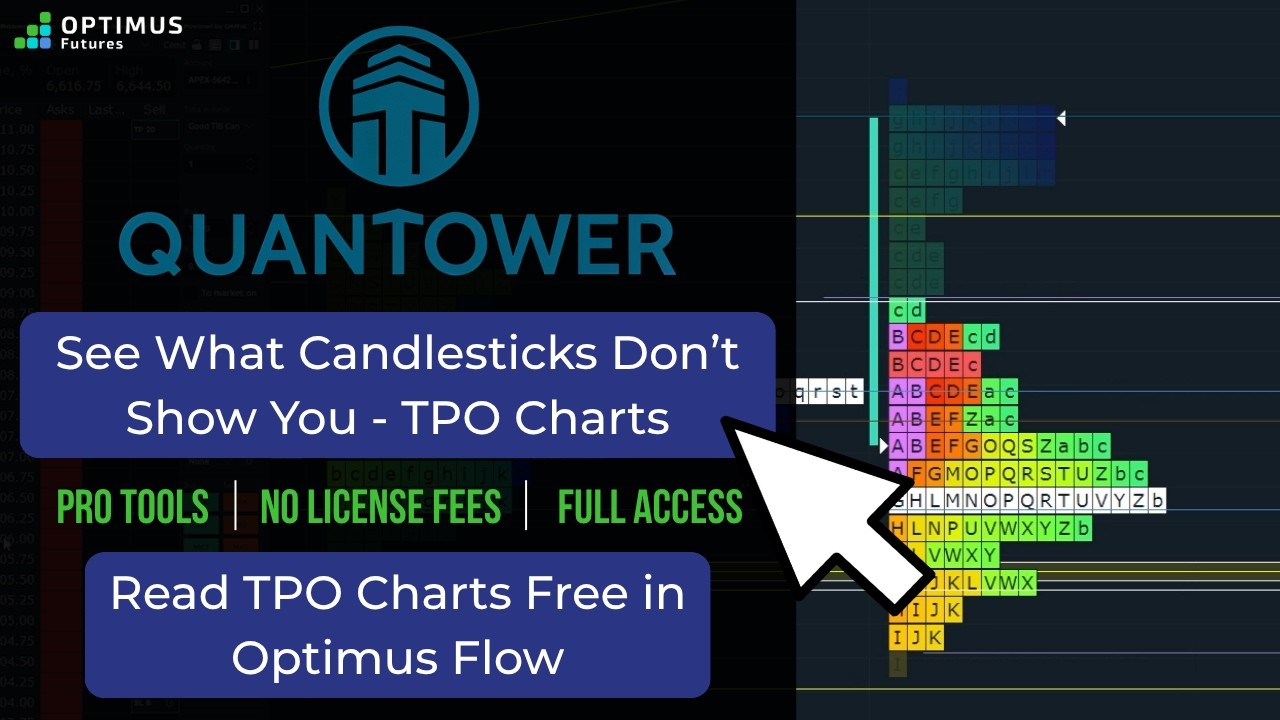
TPO Profile Chart: An invaluable chart showcases price distribution over a specific duration, highlighting the price levels where the most time has been spent. This aids traders in identifying significant support and resistance zones based on time.
Advanced Features: Enhancing a trader’s toolkit further, there’s the option for Excel integration and access to specialized chart types like Renko, Footprints, Volume Profile, Kagi, P&F, and Heikin-Ashi. Furthermore, traders can benefit from unlimited overlays & indicators, multi-synchronization capabilities, chart alerts, and much more to customize their analysis.
Power Trades: This tool is tailored for moments when a massive volume of orders gets executed within a minuscule timeframe, enabling traders to capitalize on rapid price changes.
Options Trading: For those delving into options, there’s a suite of tools to craft and evaluate option trading strategies or profiles. This suite incorporates features like the Option Desk, Option Analyzer, and tools for monitoring working orders & positions, both real and on paper, while keeping track of option Greeks.
If you’re ready to take your order flow trading to the next level, consider testing Optimus Flow and receiving a free platform demo.
===> Download Optimus Flow for free right here.
Staying Ahead In The Futures Market
In the constantly evolving world of futures trading, staying ahead of the curve is paramount. TradingView, through tools like Volume Profile, has transformed how traders visualize market activity, helping make informed decisions.
However, the introduction of Footprints, available through platforms like Optimus Flow, offers a more microscopic, real-time view of market dynamics.
Understanding and incorporating these tools can be the difference between average outcomes and extraordinary success for traders looking to elevate their game.
As markets shift and technology advances, staying updated with tools that offer the deepest insights will always be a trader’s best strategy.
Embrace the power of Volume Profile and Footprints, and pave your way to more strategic, informed, and successful futures trading.
If you’d like to learn more about incorporating Volume Profile and Footprints, get your free demo of Optimus Flow right here.
Trading in futures involves a significant risk of loss and is not suitable for all investors. Past performance is not necessarily indicative of future results. Any use of external indicators or downloaded materials is at the user’s own risk. The information provided herein is intended solely for educational purposes and does not constitute investment advice. Optimus Futures does not endorse or assume responsibility for the content or services of any external links referenced.