The article on Fair Value Gaps is the opinion of Optimus Futures, LLC.
- Fair Value Gaps (FVGs) are price jumps due to imbalanced buying and selling pressures, viewed by traders as opportunities amidst market uncertainty.
- FVGs can be spotted on charts as large candles not fully overlapped by the wicks of neighboring ones, differing from small gaps that don’t show significant buying/selling imbalances.
- Trading strategies for FVGs involve buying/shorting the gap, using FVGs as support/resistance levels, and implementing various indicators and stop losses.
What Are Fair Value Gaps?
A Fair Value Gap (FVG) as it’s often referred to, is basically a gap that forms when the buying and selling forces are wildly out of balance.
What causes this mismatch? Well, it could be a ton of things – a major news event, the release of certain economic data, or even hefty trades by big institutions. Does that make sense?
Let’s talk about how price action traders view Fair Value Gaps or FVGs. They often see these as chances to jump into the market, banking on the likelihood that the market will swing back to cover the gap before it carries on in the direction it was originally heading.
But here’s a word of caution – FVGs can sometimes act like pitfalls. There might be instances where the market doesn’t fill the gap and instead continues on its original path.
ALSO READ | How to Trade Price Gaps
But What Does “Fair Value” Even Mean? Good question. To really get how FVGs form, it helps to understand the idea of ‘fair value.’
Now, fair value is the price point where a security would be trading if the buying and selling forces were perfectly balanced. But when there’s an imbalance, that’s when the market price begins to drift away from this fair value.
In an FVG scenario, the market price will create a gap, either upward or downward, to a level that’s closer to the fair value.
Why does this happen? It’s because the imbalance in buying and selling pressures will eventually find a way to correct itself.
What Do FVGs Tell You?
FVGs indicate that there is a significant imbalance in buying and selling pressure. This imbalance can be caused by a number of factors, such as:
- News events: If there is a major news event that causes a sudden change in market sentiment, this can lead to an FVG. For example, if there is a surprise interest rate hike, this could cause the market to gap down.
- Economic data releases: Similarly, if there is a major economic data release that causes a sudden change in market sentiment, this could lead to an FVG. For example, if GDP growth is lower than expected, this could cause the market to gap down.
- Large institutional trades: Large institutional trades can also lead to FVGs. For example, if a large hedge fund is buying a large number of shares of a stock, this could cause the market to gap up.
This kind of uncertain environment can actually pave the way for opportunities for traders, particularly those who rely heavily on price action.
But like everything else in trading, it’s crucial to keep in mind the risks involved. You know what they say, right? “No risk, no reward”, but always be mindful of that risk part.
How To Identify Fair Value Gaps Gaps (and what are not FVGs)
FVGs can be identified on a chart by looking for a large candle whose neighboring candles’ upper and lower wicks do not fully overlap the large candle.
The space between the wicks of the neighboring candles is the FVG.
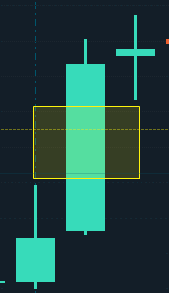
FVG
It is important to note that not all gaps are FVGs. For example, if there is a gap between two candles that are both very small, this is not an FVG.
This is because the imbalance in buying and selling pressure is not significant enough to create an FVG.
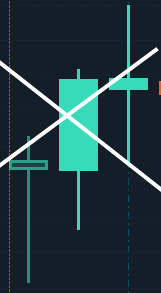
Not an FVG
Here are some of the key characteristics of FVGs:
- They are created by a significant imbalance in buying and selling pressure.
- They are often large gaps, spanning multiple candles.
- They can be found on all time frames, but they are most commonly seen on daily and weekly charts.
- They can be filled or not filled.
Basically, you’re on the lookout for a large candle on a chart that’s not fully covered by the wicks of its neighboring candles – that space in between is your FVG.
Remember, not every gap is an FVG. For instance, a gap between two tiny candles isn’t one, because the buying and selling imbalance isn’t enough to make an FVG.
Key things to remember about FVGs:
- they’re formed by a significant buying and selling imbalance,
- they’re usually big spanning multiple candles, they’re found on any time frame (though mostly on daily and weekly charts), and
- they can either be filled or remain unfilled.
Strategies for Trading Fair Value Gaps
There are a number of different strategies that can be used to trade FVGs. Some common strategies include:
Buying the gap: This is the most common strategy for trading FVGs. The idea is to buy the market at the price level of the gap, and then sell it once the market retraces back to the gap.
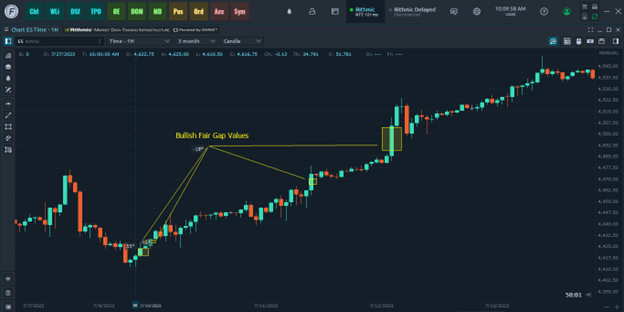
ES – 1-hour chart 7.7 to 7.13.23.
In this example, a trader could have used multiple exit strategies to take profits.
Shorter term traders might have taken a measured move approach, waiting for the position to reach a certain percentage of the amount risked (e.g. 2-to-1 reward/riask), Longer term traders might be aiming at the 4630.00 (March 2022) high.
Shorting the gap: This strategy is less common, but it can be profitable if done correctly.
The idea is to short the market at the price level of the gap, and then cover the short once the market retraces back to the gap.
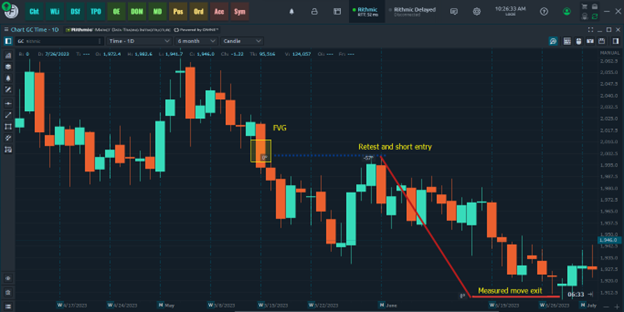
GC Daily Chart 4.11 to 7.4.23. Chart illustrates the FVG, retest, and profit target using the measured move method.
Using FVGs as support or resistance: FVGs can also be used as support or resistance levels.
For example, if a market gaps up and then retraces back to the gap level, this level can often act as support in the future.
Additional Tips for Trading FVGs
- Use a combination of indicators: It is often helpful to use a combination of indicators to trade Fair Value Gaps. This will help to confirm the trade and reduce the risk of false signals.
- Use stop losses: It is important to use stop losses when trading Fair Value Gaps. This will help to protect your profits and limit your losses.
- Wait for confirmation: Before entering a trade, it is important to wait for confirmation that the market is actually going to retrace back to the gap. This can be done by looking for a bullish or bearish reversal candle at the gap level.
- Be patient: Trading Fair Value Gaps can be a patient game. It is important to be patient and wait for the right trade before entering.
The Bottom Line
Fair Value Gaps (FVGs) are price jumps that happen when buying and selling pressures are not balanced, caused by things like big news, economic data releases, or large institutional trades.
Traders see these gaps as a sign of market uncertainty and potential opportunities.
However, they can also be risky, as the market might not always cover the gap. You can spot FVGs on a chart as large candles not fully overlapped by the wicks of their neighbors.
Not all gaps are FVGs; small gaps, for example, do not signal a significant buying and selling imbalance.
When trading FVGs, common strategies include buying or shorting the gap, and using FVGs as support or resistance levels.
It’s also advised to use a mix of indicators, stop losses, wait for confirmation, and be patient when trading FVGs. Understanding these can help you navigate the market better, but always consider the risks.
Trading in futures involves a significant risk of loss and is not suitable for all investors. Past performance is not necessarily indicative of future results.