This article on Order Flow Trading is the opinion of Optimus Futures.
Order Flow Trading: Unveiling Market Dynamics
In the world of futures markets, traders are constantly seeking effective methodologies to gain an edge. Among these, order flow trading stands out as a powerful approach that delves deeper than traditional technical analysis. By observing the intricate dance between buyers and sellers in real-time, order flow trading offers traders a unique lens through which to view market dynamics.
This article explores the fundamentals of order flow trading, its key components, and how it can be leveraged to make more informed trading decisions. We’ll examine why markets move, the types of orders that drive these movements, and how tools like the Depth of Market (DOM), Footprint charts, and Volume Profiles can unveil hidden market sentiments.
Whether you’re a seasoned trader looking to refine your strategy or a newcomer eager to understand market mechanics, this post will equip you with valuable insights into the world of order flow trading.
Let’s dive in and discover how this methodology can transform your approach to the markets.
Let’s start with why markets move.
Markets are made up of two types of orders:
- Limit Orders
- Market Orders
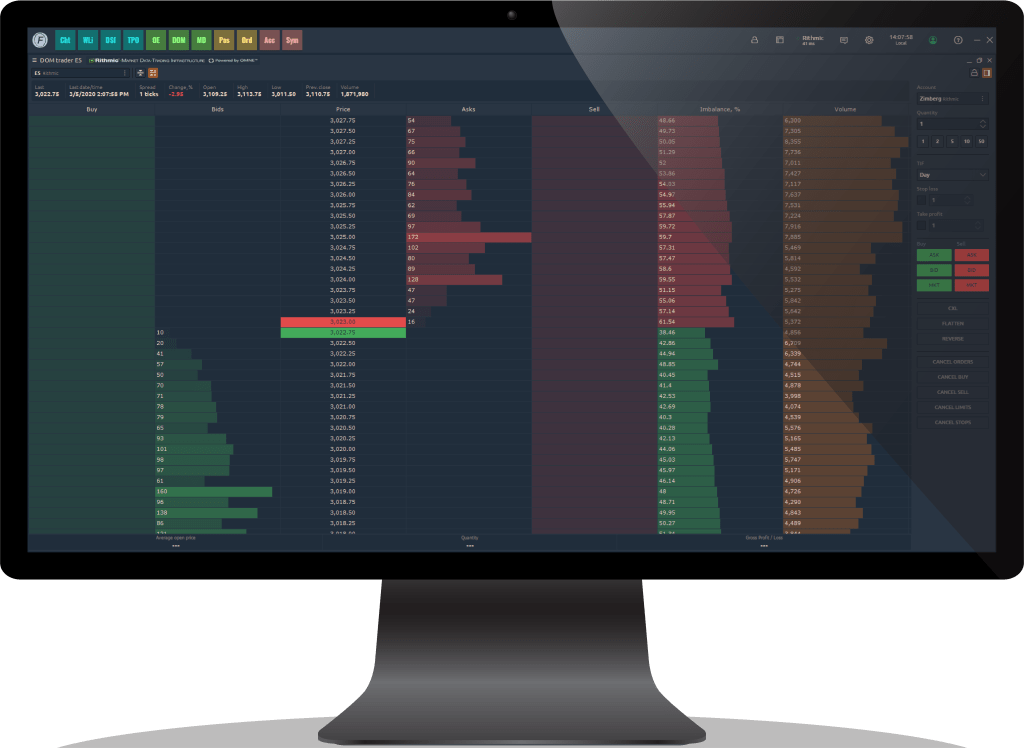
To understand how these orders affect the market price, take a look at the DOM below:
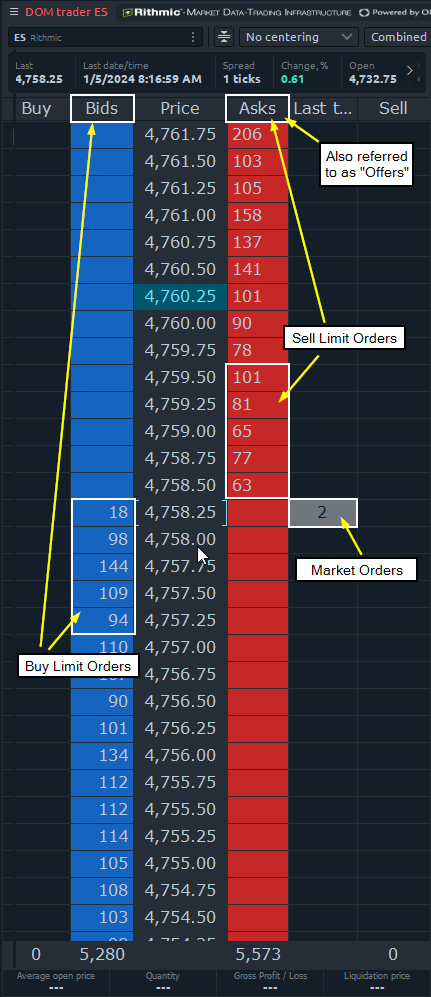
The bid and offer orders are limit orders, these are the orders that make the market. The orders shown on the right under ‘Last traded size’ are market orders.
Market Orders are the orders that move the market.
While the Limit Orders can move up and down depending on who is bidding and offering at what price, the only time the last traded price will update is when a Market Order either hits the bid or lifts the offer.
Order flow trading is observing how these orders are coming into the market and identifying patterns based on how buyers and sellers are interacting with each other.
While it is easy to see a bar chart and how price is moving, we can’t really determine from that what the sentiment of the market is.
For example, if price is coming down below an area of support, it would be easy to classify this as a classic breakdown.
However, if we are also watching the DOM or a Footprint chart, we will get much more information on how the market is accepting these orders.
Assuming this is a valid breakdown and we expect price to continue falling, logic would say that the overall sentiment is that buyers don’t want to bid the market (limit orders) until a target is met or the original sellers are taking profits.
This would mean that the bids would be moving away as price continues to fall. Think of it like this:
You want to buy a used car and you are willing to pay $10,000 for this car with the average selling price between $10,000 and $12,000 (this is the range), so you’re looking for sellers on the lower end to match your bid.
Then, you catch wind of a recall for that particular car and it becomes common knowledge this car will soon need a $3,000 repair, so sellers start lowering their price because they know buyers will be aware of this and they want to get the best price before the market finds a new value area.
As a buyer, assuming you are aware of the news and believe it, are you going to keep your bid at $10,000 or would you stop looking until prices come down to the new range with the $3,000 repair priced in?
You’d pull your bid and wait.
That’s the same concept behind a valid breakdown.
Buyers would be pulling their bid because they believe there is a new value area far enough below the range and they will wait until they think the price is discounted enough to execute their buy order.
We can’t see this in a standard bar chart, that’s just not possible to see so we have to go a level deeper to see how the orders are behaving below the support of this range.
This is where the DOM and Footprint charts become extremely useful.
Many traders talk about fake breakouts or valid breakouts.
A fake breakout in this scenario would mean that price breaks below the range and buyers start absorbing the selling, again, this can only be seen in the DOM or the Footprint chart.
Absorption would be when price starts to fall but we see big buyers step in and absorb the selling action, the opposite of buyers backing off the price.
Key Components of Order Flow Trading within Optimus Flow:
- Depth of Market (DOM): The Depth of Market is a window that shows all of the raw market data for a particular market. We can see bids, offers, and market orders and even include volume profiles to see where the majority of volume is traded at each price level.
- Footprint Chart: The Footprint Chart is a beneficial tool that can be modified in several different ways to show sell and buy volume, delta, total volume, and imbalances on a historical basis. This can be used in conjunction with the DOM to verify hypotheses regarding order flow and market sentiment.
- Volume Profile: Volume Profile is a tool that can be added to any chart within Optimus Flow under the Volume Analysis Toolbar. This shows volume based on price rather than time.
The Benefits of Order Flow Trading:
- Pattern Recognition: The patterns that occur in the market happen over and over again and by looking at raw data we are seeing the purest form of the market without it being obscured by indicators or bias. The reason Order Flow Trading is so powerful is that it looks at the main drivers of price, buyers and sellers. This can be helpful in identifying patterns within the order flow.
- Imbalances: Prices move because of imbalances, if there are more buyers than sellers, price goes up. If there are more sellers than buyers, price goes down. Again, this is something we can’t see on a standard bar chart so the only way to observe these imbalances is to look at order flow.
- Optimal Entries: When we observe order flow, we start to get a sense of when buying and selling pressure are changing. We can also see through the DOM when it starts to pick up with the rate of orders coming into the market and changes in Level 2 data (Limit Orders). Because of this, Order Flow Trading can allow you to enter the market without taking unnecessary heat at times right before a move happens. The benefit of this is obvious in terms of not having a trade go against you too much, but also entering at the point right before a move eliminating the need to sit in trades for too long.
Why is Order Flow Trading Important?
Since price moves only because of market orders, seeing how those orders come into the market and at what rate can provide a lot of information on market sentiment. As we went over earlier, a bar chart doesn’t show that.
Indicators like moving averages, or Bollinger bands, don’t show the underlying reason why price is moving, they are all lagging indicators. A bar chart shows the outcome of the interaction between buyers and sellers rather than what exactly those buyers and sellers are doing at the time of interaction. Here’s an article on Best Order Flow Indicators for Order Flow trading.
Order Flow trading allows for complete visibility of every order coming into the market. When you see the orders being executed, you almost get an idea of who is doing what.
You can see where big money is soaking up liquidity below a recent high or low, or where speculative traders with smaller sizes are executing market orders.
You see the algo’s moving bids and offers constantly. You can start to see when a number is being released because the book gets thin and orders are much less frequent.
Once you start recognizing patterns with order flow, it becomes easier to execute your trades that are in line with your thesis, because you start to know what you want to see at certain points in the market.
If the market comes up to test resistance at a previous breakdown and you want to short it, you’d want to see sellers step in on the offer and not back down, then start to see buying dry up as sellers absorb all their orders.
Instead of just selling while looking at a bar chart, we can determine what we want to see and only execute if the order flow shows that.
Setting up Your Charts for Order Flow Trading
There are three main charts you can have open to properly trade order flow:
- Depth of Market
- Footprint Chart
- Volume Profile
Depth of Market
Think of this like the raw data of orders. This shows you all the level 2 data on the bid and offer along with market orders entering the market.
The DOM also allows you to enter orders, whether they are market or limit orders, directly from this screen. In actuality, this is all you need to execute your orders but can choose to enter orders from multiple places within Optimus Flow.
While there isn’t any indicator or metric we can use to measure the speed of orders coming into the market, you can see specific market shifts within the DOM by watching these orders being executed.
Footprint Chart
This is set up like a normal bar chart on whatever time frame you like to trade from.
There are many ways to set up the Footprint Chart within Optimus Flow. When we talk about order flow trading, we want to see how the level 2 data is interacting with the market orders.
In this case, the best way to set this up is to format the Footprint Chart to record how many orders are being transacted at a certain price, meaning anytime a market order hits the bid it will record it on the left side, while a market buy order lifting the offer will show on the right side.
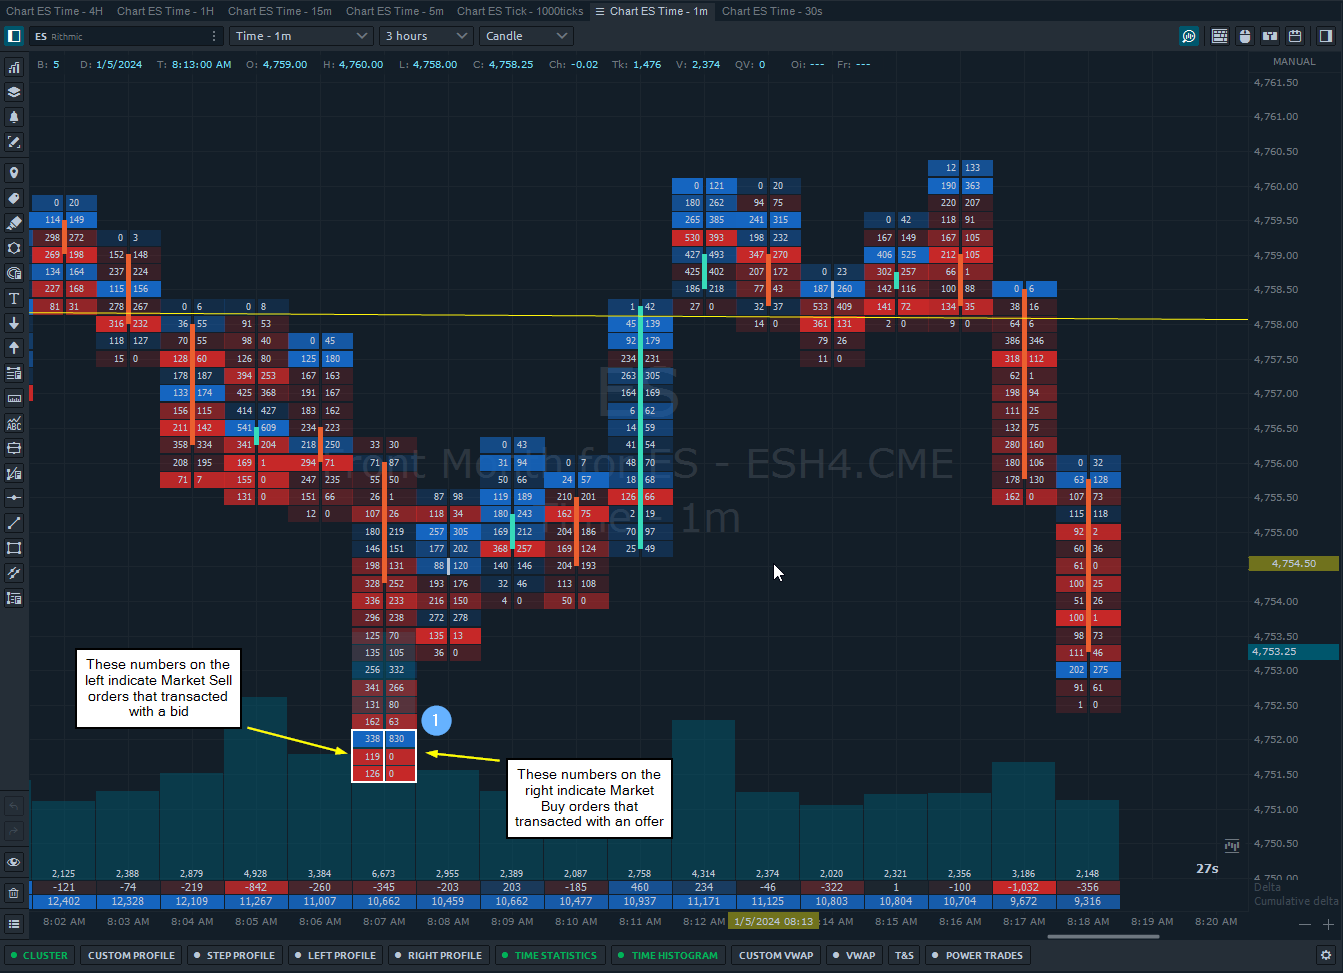
Example 1: At this point, price came down to 4752.00, and 830 market buy orders lifted the offer, meaning there was significant interest at that price for market buyers.
As we can see on this chart, that was the largest amount of buy volume compared to every other price during this time frame. This would be an area to note of importance in conjunction with your thesis.
In addition, there was limit support on the bid side, meaning while there was market selling, we saw limit bid orders absorbing that action.
The reason this is important is that with the advancement of black-box trading, not all limit orders that intend to be executed are always shown in the DOM.
These are also known as Iceberg Orders. There are other circumstances where not all orders that are intended to be executed show up on level 2 data right away.
If price comes to a level and traders see there is activity there, they may wait a few minutes before putting in a limit order. However, it is important to note that the only time a trade is recorded on this Footprint Chart is when a limit order is matched with a market order.
For instance, let’s say price pops above a recent high. In the DOM at that time we might see 200 limit orders offered at 4195.00.
But when price is trading there and buyers are lifting the offer at that price, we might see the offers reload even though there were 200 contracts originally offered.
It’s difficult to visually keep track of how many contracts were traded at that price so we look to the Footprint to monitor exactly how many market buy orders lifted the offer at that price.
This can be a good tool to observe areas of liquidity and interest at certain price levels.
READ MORE | Footprint Charts: A Futures Day Trader’s Key Tool in Identifying Trends, Reversals and Support
Volume Profile
A Volume Profile chart visually illustrates how traded volume is distributed across various price levels during a specific timeframe.
It offers traders and analysts valuable insights into the predominant areas of trading activity, facilitating the identification of crucial price levels, support and resistance zones, and potential trends in the market.
When the market is range-bound, we typically see a nice D-shaped curve on the volume profile. This indicates that the majority of the volume traded in this range is distributed evenly and the POC (Point of Control) is in the middle of the range.
If price were to break out of this range and the market found a new value area, we would see very little volume traded on the way to that new value area, with little pockets of profit taking on the way.
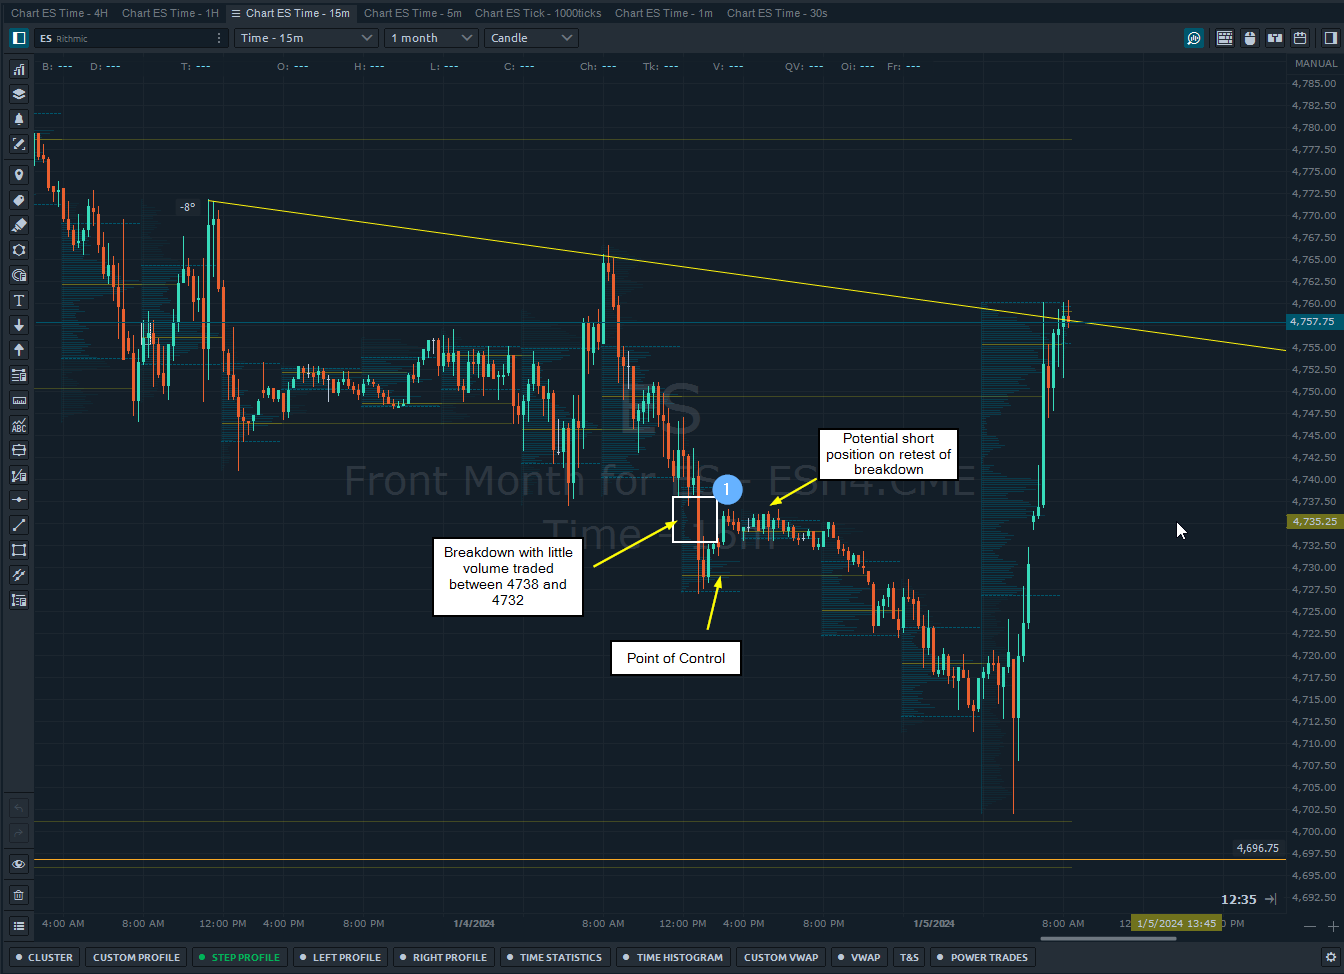
Example 1: This is what it looks like when there is a valid breakdown on a Volume Profile chart. When price breaks below support at 4738.00, it moves quickly with very little volume traded between 4738.00 and 4732.00, where it temporarily establishes a new value area around the Point of Control at 4729.00.
Because this can be classified as a valid breakdown based on the Volume Profile, a potential short position on the retest of the breakdown could be executed with a target of the Point of Control at 4729.00.
Like the Footprint chart, this is useful when used in conjunction with technical analysis. Let’s say you are long biased but the market is coming off and you are waiting for a spot to enter a long position.
Ideally, waiting for a spot with lots of volume at a key level would be better than blindly entering areas of lower volume before the market has established a new value area.
Because markets move as a result of buyers and sellers, we need to wait for areas where traders are taking positions, which is indicated by higher amounts of volume at certain price levels.
LEARN MORE | Spotting Market Trends with Volume Profile Trading
Implementing Your Order Flow Trading Strategy
Now that we have a fundamental basis of tools we can use within Optimus Flow for order flow trading, let’s discuss how to implement these into a cohesive strategy to gain an edge.
When it comes to any setup, there have to be certain things present in the market to signal an edge. On a standard bar chart, the information we see is just the surface, there is more going on with buyers and sellers that tell a more detailed story.
Now we can specify the other things we need to see with more clarity that increases the amount of edge we potentially have with a trade.
Here is a straightforward setup in a short-term uptrend channel on a 5-second bar chart:
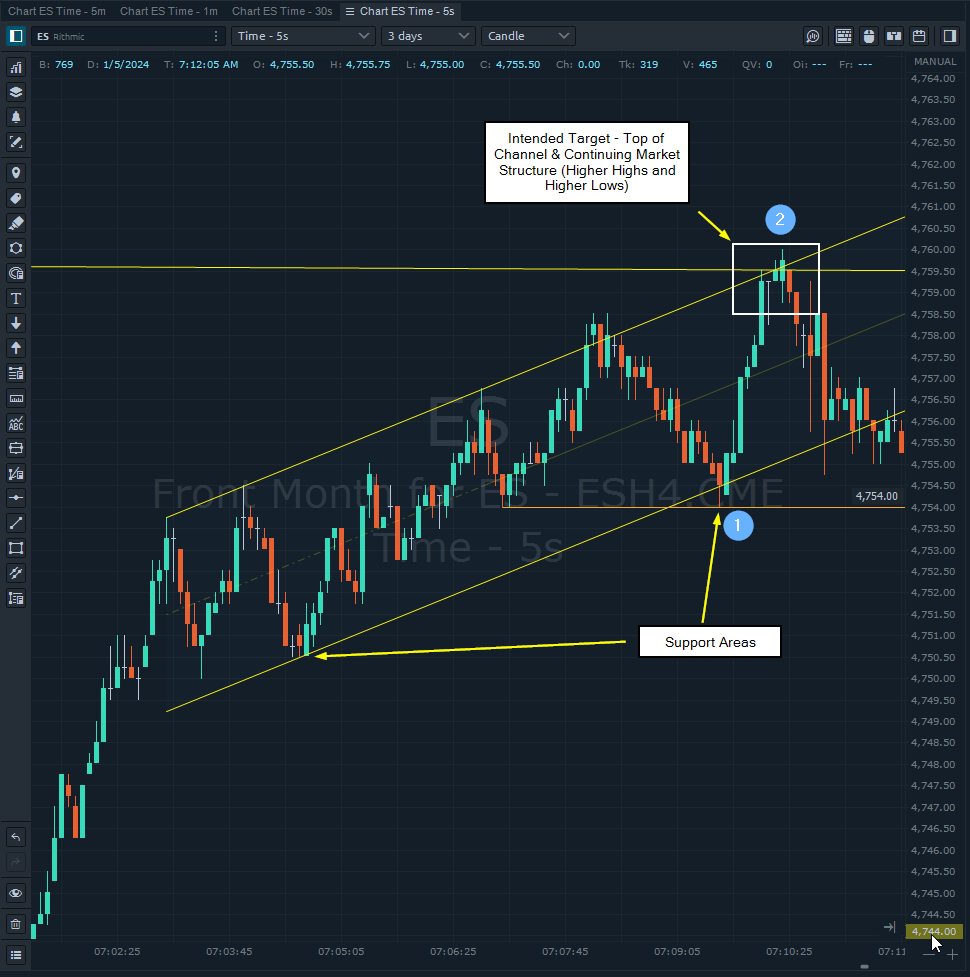
At point #1, we could have a thesis that this will hold for a potential buy order with an exit above the previous high at 4758.00.
On the bar chart, all we have to go off of is time and price. We anticipate that the 4754.00 area will hold and this uptrend pattern will continue to the 4759.50 area.
When we speak about order flow and what we want to see for this trade to be valid, what would we want to see at Point #1 and Point #2?
Ideally, at Point #1 we would like to see bid limit support and market buying to validate this trade. We could also add that we don’t want to see selling increase in this area. To confirm this we need to look at the Footprint chart:
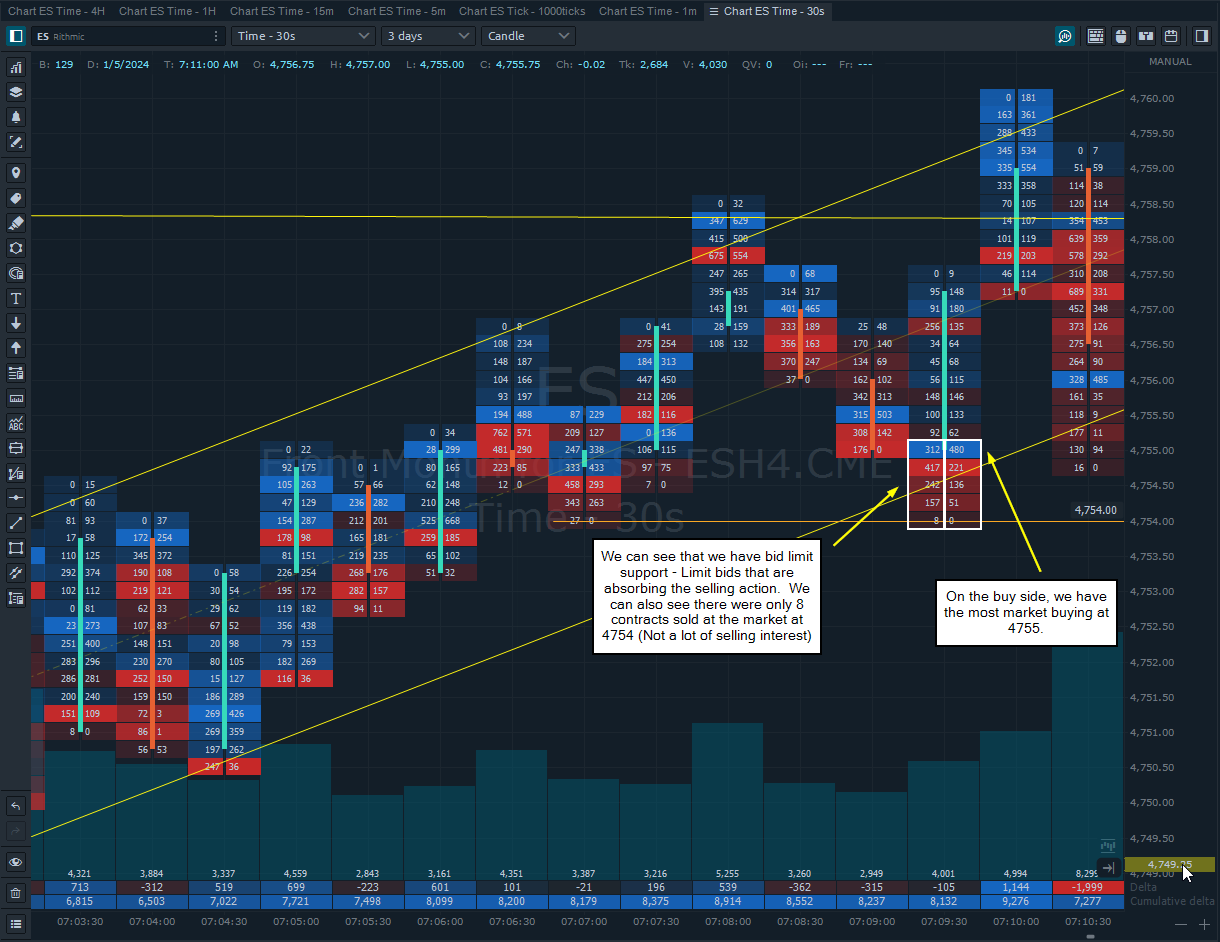
As price comes down to this lower support channel, we see both, bid limit support and market buying. As price goes below 4755.00 there is decreased market selling indicating that the overall sentiment is not to sell here.
On the exit, Point #2, how would we determine this is a valid exit? For all the traders that got long at Point #1, this is the most reasonable spot to take profits in the form of limit offers and market selling:
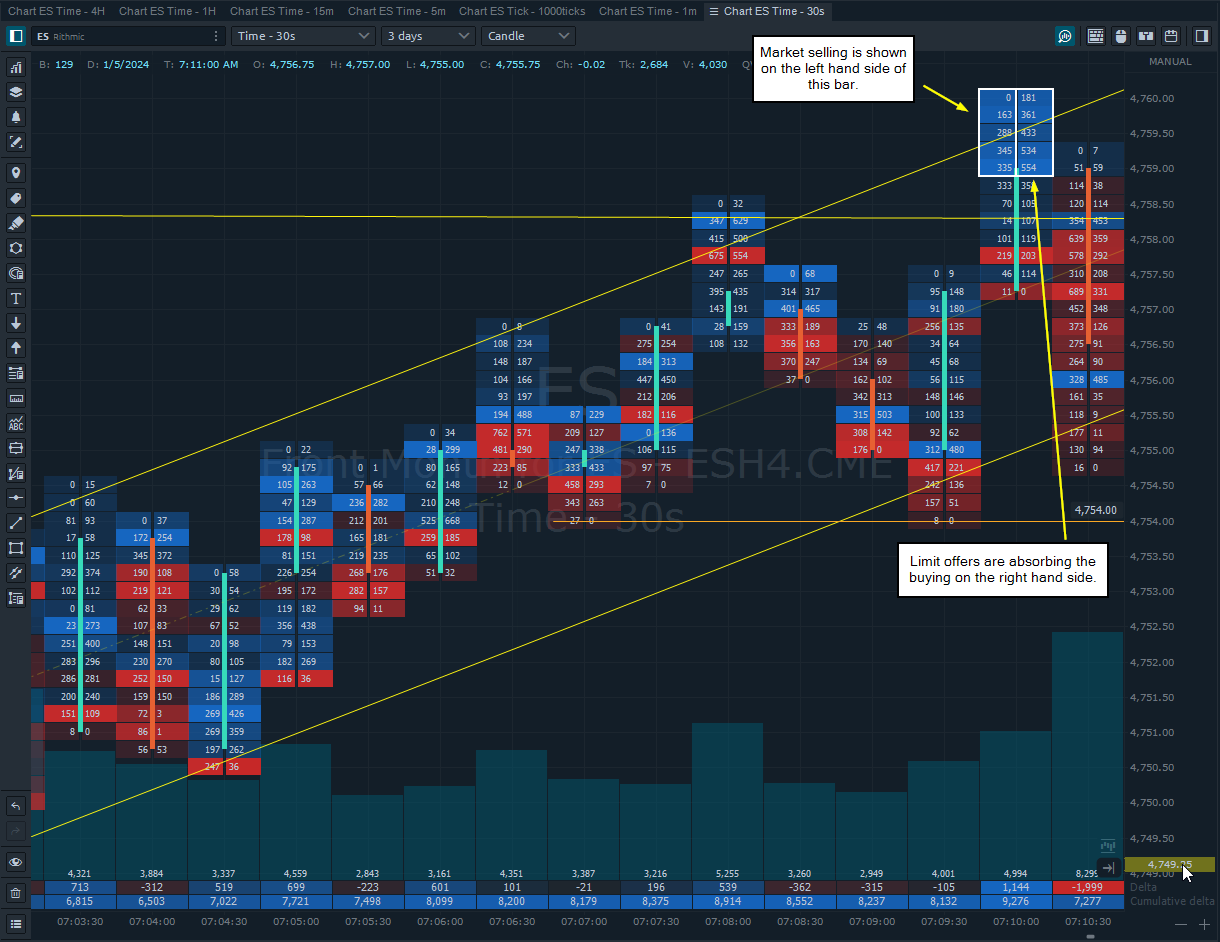
The increase in volume at the exit would indicate price might have difficulty continuing up, validating that exiting our long is the best choice here.
Furthermore, on the exit at 4759.50, there was a lot of market buying with limit offers absorbing it. There was more market buying at this point than there was at the entry. It seems that these higher prices attracted breakout traders who anticipated price to continue up.
The reason this is important is because if new participants are entering the market here and price doesn’t continue up, at some point they will have to exit their longs with a sell order.
So not only have we confirmed that our exit was valid, we have identified another area of high volume that we need to keep track of for future trades.
If this area is tested again to the upside with significant buying, sellers at this point might dump their position to fuel another leg up. If it is defended, longs will have to sell to liquidate their position adding to sell-side pressure.
The power of order flow trading allows us to gather more information in conjunction with our thesis to make better-informed decisions.
While learning Order Flow Trading can seem like a large undertaking, fully understanding it and being able to implement it into your trading is well worth it.
With order flow, we can better understand the underlying sentiment behind the market to analyze our thesis. By utilizing the Depth of Market, Footprint chart, and Volume Profile, order flow trading is easily accessible within Optimus Flow’s platform.
When we have more information about the inside of the bar and how market participants are interacting with each other, being able to identify your entries and exits becomes more accurate. Order Flow Trading is an essential and helpful tool to have in your trading strategy.
Key takeaways
- Market Mechanics: Understanding the interplay between limit orders and market orders is crucial to grasping why and how prices move.
- Essential Tools: The Depth of Market (DOM), Footprint charts, and Volume Profiles are indispensable tools for order flow traders, each offering unique insights into market behavior.
- Pattern Recognition: Order flow trading excels at identifying recurring patterns in raw market data, helping traders spot opportunities that might be invisible on standard charts.
- Imbalances and Sentiment: By observing order flow, traders can detect imbalances between buyers and sellers, gaining valuable insights into market sentiment.
- Optimal Entries and Exits: This approach can help pinpoint more precise entry and exit points, potentially improving trade timing and reducing unnecessary exposure.
- Strategy Enhancement: Incorporating order flow analysis can significantly enhance existing trading strategies, providing an additional layer of confirmation for trade setups.
While mastering order flow trading requires dedication and practice, the potential benefits make it a valuable skill for any serious trader. By combining this methodology with other forms of analysis, traders can develop a more comprehensive understanding of market behavior.
As with any trading approach, it’s important to remember that order flow trading is not a guarantee of success. However, for those willing to invest the time and effort to learn its intricacies, it can become a powerful tool in navigating the complex world of futures markets.
Try Optimus Flow
Order Flow Trading Platform
There is a substantial risk of loss in futures trading. Past performance is not indicative of future results. When considering technical analysis, please remember educational charts are presented with the benefit of hindsight. Market conditions are always evolving, and technical trading theories and approaches may not always work as intended.