The article below on ChatGPT Trading below is the opinion of Optimus Futures, LLC.

- AI is a powerful assistant, but should complement human expertise.
- High-quality prompts and follow-up questions are key to obtaining valuable trading strategies from AI models.
- AI-generated strategies must be rigorously backtested, risk managed, and filtered through human judgment and experience.

Welcome to the Era of AI-Generated Trading Strategies
In just a short amount of time, AI has changed the way we approach financial markets and strategize our investments.
This comprehensive guide explores the cutting-edge world of AI-assisted day trading strategy development., using OpenAI’s revolutionary language model, ChatGPT, and Google’s Bard chatbot. We aim to unlock the potential of using these tools to churn out a plethora of unique trading strategies tailored to your needs.
ChatGPT and Bard are Ultra-Smart Assistants But Not Replacements for Human Intelligence and Expertise
It’s crucial to remember that AI, including ChatGPT, is not a magical solution that makes flawless decisions.
Instead, consider it a hyper-intelligent, indefatigable assistant to augment your trading prowess.
At the end of the day, you hold the reins – making final decisions, customizing strategies, backtesting, and bearing the responsibility for all risks involved in live market trading.
Quality Prompts (Input) Begets Quality Solutions (Output)
The key to successfully employing ChatGPT and Bard lies in mastering the art of follow-up prompts.
The initial prompts are straightforward, but the real skill is in fine-tuning and guiding the AI to generate practical and targeted strategies.
This involves having a clear understanding of what you are seeking, and the ability to delve into the specifics such as the market, indicators, and timeframe.
This tutorial will equip you with the knowledge needed to effectively communicate with ChatGPT and Bard.
The first part will cover the preliminary planning and conceptual understanding.
The second part will illustrate specific examples of crafting an initial prompt and its respective follow-ups. The main focus will be on refining the conversational flow with the AI to extract high-quality trading strategies.
Once equipped with a strategy, we’ll cover a few prompts for risk management and position sizing. Be sure to backtest and forward test your strategies before you eventually implement them in a live market.
REMEMBER, RISK MANAGEMENT SHOULD ALWAYS BE AT THE FOREFRONT OF YOUR TRADING DECISIONS.
Part 1 – Six Tips to Consider Before Firing-Up ChatGPT and Bard
In this section, we provide a series of prompts to guide you through a holistic process of developing a trading strategy to maximize your potential for success.
Starting with defining your trading objectives, we’ll help you navigate through selecting financial instruments, choosing relevant technical indicators, and establishing precise entry and exit criteria.
You’ll learn to incorporate risk management, backtest your strategy, and optimize for performance.
Additionally, we’ll stress the importance of tracking trades and adapting to market changes. Using these prompts with ChatGPT and Bard, you’ll be able to tailor a comprehensive and robust trading strategy suited to your needs.
1 – Define Your Trading Objective:
Begin by clearly establishing your overall trading objective. This could be anything from seeking short-term gains, to making long-term investments, or aiming for a specific risk-reward ratio.
You must consider if you’re focusing on certain time frames such as day trading or swing trading, or specific trading styles like trend following or mean reversion.
Don’t forget to take into account any constraints or limitations, such as the size of your capital or any regulatory restrictions that might affect your trading activities.
2 – Select Technical Indicators:
Once your objectives are set, you’ll need to identify the technical indicators that are commonly used in your chosen market or align with your trading style.
Explore specific indicators you wish to incorporate or combine in your strategy, understanding how they can help identify potential entry and exit points in your trades.
3 – Incorporate Risk Management:
Risk management forms a critical part of any trading strategy. You’ll need to consider techniques such as stop losses, position sizing, risk-reward ratios, and portfolio diversification.
Think about your maximum acceptable risk per trade and overall risk exposure. Reflect on the importance of your chosen risk management techniques and determine how you’ll adjust your position sizing based on your risk management rules.
4 – Backtest and Validate Your Strategy:
Once your strategy is in place, you’ll want to backtest it using historical data. This might involve using specific software or platforms.
Pay close attention to the performance metrics you’ll track during this phase, such as profitability, drawdowns, win rate, and risk-adjusted returns.
You’ll also need to decide on the statistical measures or visual representations you’ll use to evaluate your strategy’s performance.
5 – Optimize and Refine Your Strategy:
Next, think about how you’ll optimize your strategy to improve its performance. This could involve parameter optimization, sensitivity analysis, or incorporating additional filters or conditions.
There’s a delicate balance to strike between complexity and simplicity in your strategy. Understanding the concept of parameter optimization can enhance your strategy’s performance.
Discover the tools or techniques you can use to find the optimal parameter values for your strategy.
6 – Continuously Monitor and Adapt:
Lastly, keep in mind that trading strategies need to be adaptable to changing market conditions or when they no longer perform as expected. Stay alert for signs that indicate the need for strategy adaptation or refinement.
Continuous monitoring and adaptation keep your strategy dynamic and relevant in the fluid world of trading.
Now, let’s generate a few trading ideas using ChatGPT.
Part 2 – Generating Ideas for a VWAP-based Day Trading System Using ChatGPT
Let’s ask ChatGPT to come up with a day trading system using the VWAP indicator.
|
| ChatGPT:
Certainly! Here are some trading rules based on the Volume-Weighted Average Price (VWAP) indicator that you can consider for a futures day trading system: VWAP Crossover: Enter a long position when the price crosses above the VWAP line and exit the position when the price crosses below the VWAP line. Similarly, enter a short position when the price crosses below the VWAP line and exit when the price crosses above the VWAP line. This strategy assumes that crossing above or below VWAP indicates a potential change in market sentiment. VWAP Breakout: Enter a long position when the price breaks above the VWAP line with a significant increase in volume and exit the position when the price retraces below the VWAP line. Conversely, enter a short position when the price breaks below the VWAP line with a significant increase in volume and exit when the price retraces above the VWAP line. This strategy aims to capture momentum and breakouts in the market. VWAP Reversal: Enter a long position when the price drops below the VWAP line and then quickly reverses back above it. Exit the position when the price retraces below the VWAP line again. Conversely, enter a short position when the price rises above the VWAP line and then quickly reverses back below it. Exit the position when the price retraces above the VWAP line again. This strategy assumes that such reversals may indicate a shift in market direction. VWAP Bands: Define upper and lower bands around the VWAP line, such as a certain percentage above and below it. Enter a long position when the price touches or crosses below the lower band and exit when it reaches the VWAP line. Similarly, enter a short position when the price touches or crosses above the upper band and exit when it reaches the VWAP line. This strategy assumes that prices tend to revert to the mean represented by the VWAP. Remember, these rules are just starting points, and it’s essential to thoroughly backtest and validate any trading strategy before using it with real money. Market conditions can change, and it’s crucial to adapt and adjust your rules accordingly. Additionally, consider incorporating risk management techniques such as stop-loss orders and position sizing to protect your capital. |
Let’s suppose we’re interested in the third suggestion (VWAP Reversal). You need to ask ChatGPT to expand on this suggestion.
|
| ChatGPT:
Certainly! When using the VWAP reversal strategy, you can consider the following guidelines for stop losses, profit targets, and additional indicators: Stop Loss: Place a stop loss order below the recent swing low for long positions or above the recent swing high for short positions. This level acts as a point where you exit the trade if the market moves against you. By placing the stop loss below the swing low (for long positions), you aim to limit potential losses if the reversal fails and the price continues to decline. Profit Target: There are a few approaches you can consider for setting profit targets: a. VWAP Retest: Set a profit target at the VWAP line or slightly above it. The idea is to capture a portion of the reversal move back to the VWAP level. This approach assumes that the price tends to revert to the mean, represented by the VWAP b. Swing High/Low: Identify a recent swing high or low as a potential profit target. For long positions, consider setting the profit target near a previous swing high, while for short positions, target a previous swing low. This approach aims to capture potential price reversals at key levels of support or resistance. c. Trailing Stop: Use a trailing stop loss that adjusts as the trade moves in your favor. For example, you can set the stop loss at a certain percentage or fixed distance below the highest high reached since entering the trade. This allows you to lock in profits as the trade progresses while giving the position room to run. Additional Indicators: While the VWAP reversal strategy focuses primarily on the VWAP indicator, you can consider additional indicators to enhance your trading decisions. Here are a few examples: a. Support and Resistance Levels: Identify key support and resistance levels on your chart and consider them in conjunction with the VWAP. These levels can provide additional confirmation or act as profit targets. b. Moving Averages: Add shorter-term or longer-term moving averages (e.g., 50-day or 200-day) to your chart. They can act as dynamic support or resistance levels and help you gauge the overall trend. c. Relative Strength Index (RSI): Include the RSI indicator to assess overbought or oversold conditions. If the RSI indicates that the market is overbought and the price is reversing near the VWAP, it may strengthen the case for a short trade. Conversely, if the RSI suggests oversold conditions and the price is reversing near the VWAP, it may support a long trade. Remember to experiment and test different combinations of indicators and parameters to find what works best for your trading style and the specific market you’re trading. |
It seems complete, but ChatGPT is capable of “thinking” at depths beyond what may already seem detailed. Sometimes, these levels produce nothing useful, but sometimes they do. So, let’s ask ChatGPT to drill down even more.
|
| ChatGPT:
Certainly! Here are some additional details to make the VWAP Reversal strategy more accurate: Confirmation of Reversal: Instead of entering a position immediately after the price reverses back above or below the VWAP line, you can wait for additional confirmation. This confirmation could come in the form of a candlestick pattern, such as a bullish engulfing pattern for long positions or a bearish engulfing pattern for short positions. These patterns suggest a strong reversal in sentiment and can provide more confidence in your trade entry. Volume Confirmation: Pay attention to volume during the reversal. An increase in volume when the price moves back above or below the VWAP line strengthens the reversal signal. Higher volume suggests increased market participation and conviction behind the price move, increasing the likelihood of a sustained reversal. Timeframe Selection: Consider using multiple timeframes to fine-tune your entries. For example, you can use a higher timeframe, such as the 1-hour or 4-hour chart, to identify the overall trend and direction. Then, drop down to a lower time frame, such as the 15-minute or 5-minute chart, to time your entries and exits based on VWAP reversals. This approach helps you align your trades with the broader market trend. Trend Filter: Integrate a trend filter to ensure you’re trading in the direction of the overall trend. For example, you can add a moving average (e.g., 50-day or 200-day) to your chart and only take long trades if the price is above the moving average or short trades if the price is below it. This filter helps avoid counter-trend trades and improves the accuracy of your entries. Multiple Timeframe Analysis: Combine the VWAP reversal strategy with multiple timeframe analysis. For instance, if you spot a VWAP reversal on the lower timeframe, check if it aligns with a key support or resistance level on a higher timeframe. This confluence of factors increases the probability of a successful trade. Risk Management: Implement proper risk management techniques. Determine your risk tolerance for each trade and set a stop loss accordingly. Consider using a position size calculator to ensure you’re risking a fixed percentage or amount of your trading capital per trade. This approach helps protect your account from excessive losses. Remember, no trading strategy can guarantee profits, and it’s essential to thoroughly backtest and practice the strategy on historical data before using it in live trading. Adjust and refine the strategy based on your own trading preferences, risk tolerance, and market conditions. |
We’re glad we asked. Many of these suggestions were useful to the development of this trading strategy.
So far, this is what our strategy might look like:
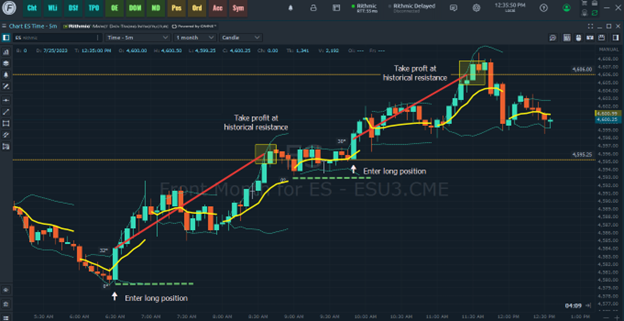
Following ChatGPT’s suggestions, we placed a stop loss below the most recent swing low and took profits at historical resistance for our hypothetical trade example.
Part 3 – Generating Ideas for a Consecutive Candlestick Day Trading System Using Bard
First off, what is Bard? Bard is a large language model developed by Google. It’s like a big encyclopedia that can answer your questions and generate different creative text formats, like poems, code, scripts, musical pieces, email, letters, etc.
Bard is still under development, but it already has a formidable scope of information and idea generation capabilities.
Think of it like a giant language robot assistant. It also has a different approach from ChatGPT.
Sometimes, it’s better, sometimes, it needs improvement. Ultimately, it’s up to you to decide which AI system works best.
Let’s fire it up and see what it can do.
|
| Bard:
Sure, here are a few high probability scalping strategies based on 3 consecutive bar or candlestick patterns: Three White Soldiers: This is a bullish pattern that consists of three consecutive green candles with long bodies and small wicks. It signals a strong buying trend and is often followed by a sharp price increase. Three Black Crows: This is a bearish pattern that consists of three consecutive red candles with long bodies and small wicks. It signals a strong selling trend and is often followed by a sharp price decrease. Morning Star: This is a bullish reversal pattern that consists of a long red candle, followed by a small white candle, and then a long green candle. The long red candle signals a continuation of the downtrend, the small white candle signals a pause in the downtrend, and the long green candle signals a reversal to the uptrend. Evening Star: This is a bearish reversal pattern that consists of a long green candle, followed by a small red candle, and then a long black candle. The long green candle signals a continuation of the uptrend, the small red candle signals a pause in the uptrend, and the long black candle signals a reversal to the downtrend. Engulfing Pattern: This is a reversal pattern that can be either bullish or bearish. It consists of a small candle that is engulfed by a larger candle of the opposite color. For example, a bullish engulfing pattern would have a small red candle followed by a larger green candle. |
Okay. That’s a good list. Still, each of these strategies have different historical stats. Which one’s might you start with first,. In other words, can we prioritize them according to performance?
Remember, Bard has Google’s entire database of knowledge. This doesn’t mean that the data you’re looking for is correct, and that’s why you’ll need to test the strategies independently. But it certainly beats having to slog through each system yourself. So, let’s try a few follow-up prompts, starting with whether or not it works on smaller timeframes.
|
| Bard:
Yes, these candlestick patterns can work on a 5-minute chart. However, it is important to note that the patterns may not be as reliable on shorter time frames. This is because price movements on shorter time frames can be more volatile and unpredictable. If you are scalping on a 5-minute chart, it is important to use other indicators and techniques to confirm your trading signals. For example, you could use the relative strength index (RSI) or the moving average convergence divergence (MACD) to identify overbought or oversold conditions. You could also use volume data to help you identify strong trends. For example, if you see a bullish candlestick pattern with strong volume, this is a sign that the bulls are in control and the trend is likely to continue. It is also important to remember that scalping is a high-risk trading strategy. You should only trade with money that you can afford to lose. And you should always use a stop loss to protect your profits and losses. Here are some additional tips for scalping on a 5-minute chart: Use a small position size: This will help you to manage your risk. Take profits quickly: Don’t wait for the perfect trade. Take profits as soon as you are in profit. Be patient: Don’t rush into trades. Wait for the right signals. Scalping on a 5-minute chart can be a profitable trading strategy, but it is important to use it wisely and to manage your risk carefully. |
Okay, so know we know what it thinks with regard to using it with a timeframe more suitable for day traders. But which strategy should we try first?
|
| Bard:
The three candlestick patterns that have yielded the most successful results are the: Three White Soldiers: This pattern has a success rate of around 70%. Morning Star: This pattern has a success rate of around 60%. Engulfing Pattern: This pattern has a success rate of around 50%. However, it is important to note that these are just averages, and the success rate of any pattern can vary depending on the market conditions. It is also important to use other indicators and techniques to confirm your trading signals. Here are some additional tips for using these patterns: Look for strong confirmation: The patterns are more likely to be successful if they are accompanied by strong confirmation from other indicators. For example, the Three White Soldiers pattern is more likely to be successful if it is accompanied by a rising moving average. Use a stop loss: Always use a stop loss to protect your profits and losses. Trade with the trend: These patterns are more likely to be successful if they are traded with the trend. Be patient: Don’t rush into trades. Wait for the right signals. |
Bard just gave us historical performance stats, and that’s a good start. So, let’s have it develop a strategy for us.
|
| Bard:
Sure, here is a complete trading strategy for Three White Soldiers: Entry Rules: The Three White Soldiers pattern must form at the bottom of a downtrend. The three candles must be all bullish, with long bodies and small wicks. The closes of the three candles must be progressively higher. Exit Rules: Take profits when the price reaches a predetermined target. Place a stop loss below the lowest low of the Three White Soldiers pattern. Other Indicators: The Three White Soldiers pattern is more likely to be successful if it is accompanied by other bullish indicators, such as a rising moving average or a positive RSI reading. You can also use volume data to help you identify strong trends. For example, if you see a bullish candlestick pattern with strong volume, this is a sign that the bulls are in control and the trend is likely to continue. Other Advice: Use a small position size when trading the Three White Soldiers pattern. Be patient and wait for the right signals. Don’t trade if the market conditions are not favorable. Here are some additional tips for trading the Three White Soldiers pattern: Use a trend-following stop loss: This type of stop loss will move with the trend, so you will be less likely to be stopped out prematurely. Use a trailing stop loss: This type of stop loss will follow the price action, so you will be able to lock in profits as the price moves in your favor. Use a combination of technical analysis and fundamental analysis: This will help you to make more informed trading decisions. The Three White Soldiers pattern is a popular and effective trading strategy. However, it is important to use it wisely and to manage your risk carefully. By following these tips, you can increase your chances of success when trading this pattern. |
WAIT! AS FAR AS A TRADING STRATEGY IS CONCERNED, THIS IS “OKAY,” AS IN, JUST OKAY.
It’s not enough. not nuanced enough. we need something better.
So, let’s turn to ChatGPT.
| ChatGPT:
Three White Soldiers Trading Strategy Setup and Entry Rules: Identify a prevailing downtrend: The Three White Soldiers pattern is considered a bullish reversal pattern and is more reliable when it appears after a clear downtrend. Spot the Three White Soldiers pattern: This pattern consists of three consecutive long-bodied candlesticks that have closed higher than the previous day, with each session’s open occurring within the body of the previous candle. Entry point: Enter a long position at the opening of the next candle after the Three White Soldiers pattern has completed. Alternate entry: If you want to be more conservative, you might wait for a slight pullback after the pattern before entering a long position. Stop Loss Rules: The ideal place to set your stop-loss order is slightly below the low of the third candle of the pattern. This placement is chosen because it’s the point that confirms the bullish reversal. Alternatively, a more conservative stop loss could be placed below the low of the first or second candle of the pattern. However, this may increase the risk of an early stop out. Take-Profit Rules: One method for setting a take-profit point is to establish a reward-to-risk ratio. For example, if your stop loss is 100 points below your entry point, you might set your take-profit level 200 points above your entry point, establishing a reward-to-risk ratio of 2:1. Another method might be to look for key resistance levels in the market. These are prices at which the asset has reversed in the past. The idea is that these levels may act as barriers again, causing the price to reverse once more. Other Indicators to Increase the Probability of Success: Volume: A significant increase in volume during the Three White Soldiers formation can be a strong confirmation of a reversal. Relative Strength Index (RSI): This can help you understand if the asset is overbought or oversold. An oversold reading followed by a Three White Soldiers pattern could strengthen the bullish reversal signal. Moving Averages: Look for the price to break above a significant moving average (like the 50-day or 200-day) as another confirmation of the bullish trend. Stochastic Oscillator: This momentum indicator can also help you verify whether the asset is overbought or oversold. A crossover from oversold levels can further validate the bullish reversal signal. Other Advice: Like any trading strategy, the Three White Soldiers pattern should not be used in isolation. Always combine it with other technical analysis tools or indicators to increase your chances of success. Backtest the strategy before implementing it in the live market. Be aware of any major news events or economic releases that could impact the asset you are trading. High volatility during these times could potentially invalidate the signal. It’s crucial to manage your risk effectively with any trading strategy. Never risk more than a small percentage of your trading capital on any single trade. Remember, no trading strategy is foolproof, and it’s essential to be prepared for losses. Risk management and emotional control are just as critical as the strategy itself for long-term trading success. |
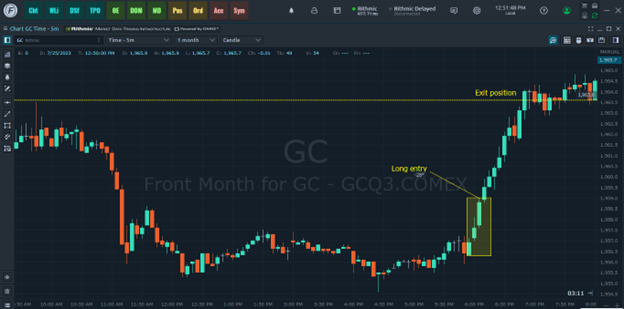
This is it. But notice how we needed to combine the AI brain power of two chatbots to arrive at this system. This is what the system looks like.
Still, these strategies aren’t complete without an aggressive (and defensive) position sizing strategy. So, let’s explore that next.
Part 4 – Generating Position Sizing Ideas for Your Strategies
ChatGPT didn’t do the best job for the following prompt, so I decided to switch to Bard (Google AI chatbot), and the results were much stronger.
|
| Bard
Sure, here are a few aggressive position sizing methods for trading: Fixed percentage risk per trade: This is the most common aggressive position sizing method. You simply risk a fixed percentage of your account balance on each trade. For example, if you have a $10,000 account and you’re willing to risk 2% per trade, then you would only risk $200 on each trade. Kelly Criterion: This is a more sophisticated position sizing method that takes into account the expected return and volatility of the trade. The Kelly Criterion tells you the optimal amount to risk on each trade in order to maximize your long-term profits. Volatility-based position sizing: This method sizes your positions based on the volatility of the underlying asset. The idea is that you should risk more on trades that have a higher probability of success and less on trades that have a lower probability of success. Averaging down: This method involves averaging down your position size as the price of the asset declines. This can be an aggressive way to trade, but it can also be very risky. Kelly Plus: This method is similar to optimal f, but it takes into account the risk of ruin. The Kelly Plus method tells you the optimal amount to risk on each trade in order to maximize your profits while minimizing the risk of ruin. Optimal F: This method was developed by Ralph Vince. It is a more aggressive method than fixed percentage risk per trade, but it can also be more risky. The optimal f method calculates the optimal fraction of your account balance to risk on each trade based on your historical win rate, average win size, average loss size, and maximum drawdown. The idea is that you should risk more on trades that have a higher win rate and a lower average loss size, and less on trades that have a lower win rate and a higher average loss size. Variable F: This method allows you to adjust your position size based on your risk tolerance. If you have a high risk tolerance, you can use a higher f value. If you have a low risk tolerance, you can use a lower f value. Secure F: This method is similar to optimal f, but it takes into account the maximum drawdown that you are willing to tolerate. The Secure F method tells you the optimal amount to risk on each trade in order to maximize your profits while minimizing the risk of a drawdown that exceeds your target. It’s important to note that aggressive position sizing methods can be very risky. If you’re not careful, you could lose a lot of money. Therefore, it’s important to only use these methods if you have a high risk tolerance and you’re confident in your trading skills. Here are some additional things to keep in mind when using aggressive position sizing methods: Use stop losses: Always use stop losses to protect your profits and limit your losses. Trade with a small account: If you’re new to aggressive position sizing, it’s a good idea to trade with a small account until you get more experience. Backtest your strategies: Before you start using aggressive position sizing methods in real-time, backtest your strategies on historical data to see how they would have performed. I hope this helps! |
I’ll stop here and let you explore this further.
The main point in this article is that the quality of your AI-generated trading strategy ideas depend on the quality of prompts.
Ask common questions and you’ll get a common answer. Ask deeper questions and you’ll get more unique answers.
There’s So Much More You Can Do
The examples above focus on just two trading strategies. Imagine what you can do with strategies based on order flow, trend following, and other popular indicators like the MACD.
In other words, this tutorial is just the tip of the iceberg, pardon the cliche (but it’s true).
SEE ALSO:
The Bottom Line
The rise of AI-generated trading strategies has transformed the landscape of financial markets, offering traders a wealth of innovative possibilities.
OpenAI’s ChatGPT, Google’s Bard, and other language models have proven to be invaluable tools for generating tailored trading strategies. However, while these AI systems are powerful assistants, they are not a substitute for human intelligence and expertise.
Traders must exercise caution, thoroughly backtest their strategies, and adhere to risk management practices to navigate the inherent risks of trading.
The key to success lies in asking high-quality prompts and fine-tuning the conversational flow with AI to extract practical and targeted strategies.
By combining AI’s potential with human judgment and experience, traders can navigate the complex world of financial markets with greater confidence and insight.
There is a substantial risk of loss in futures trading. Past performance is not indicative of future results.