This article on Price Action Trading Secrets is the opinion of Optimus Futures.

If you’re a trader who’s been around the block a few times, any mention of “trading secrets” may sound a bit salesy and suspicious, and for a good reason (every trading system vendor or so-called “guru” has a “secret” you won’t find anywhere else…so they say).
When we think of “trading secrets,” we tend to imagine them to be something like ultra-sophisticated methods or proprietary concepts, new ideas and approaches that can give a trader some edge over those who don’t yet possess them.
But a secret can also mean things that are common yet overlooked. Like price action itself, something that most investors overlook. While they see a naked chart that signals “lack,” price action traders see an abundance of possibilities, interpretations, and potential outcomes.
In light of this, we have compiled a list of 10 price action trading secrets to consider. They can help you better understand the markets and make more informed trading decisions.
These price action trading secrets are not ultra-sophisticated, proprietary, or exclusive. Instead, they’re rather accessible to all who take the time to learn and apply them.
Price Action Trading Secret #1 – There Are Many Trends Within and Beyond a Single Trend
If you’re trading an uptrend on the 5-minute chart, what if the hourly and daily charts are trending downward?
Would that change your trading bias? For some traders, it might. Whatever the case may be, you should at least be aware of it.
Price action trading requires great awareness, particularly if you’re not using other indicators that may either help or distract you. You’re responsible for seeing the big picture.
READ ALSO | What is Price Action? An Introduction to Price Action Trading
Here’s an analogy: if you’re walking through a city, you might notice different things depending on how fast you’re moving and your angle of perspective. If you’re driving in a car, you’ll see the big picture—the city skyline, major landmarks, and main roads.
But if you’re walking, you’ll notice smaller details—the street art, local shops, and hidden alleys. It’s the same with trading: the timeframe you’re looking at can greatly affect the price trends you see.
For example, let’s say you’re looking at an asset that’s been in an overall uptrend for the past year. If you look at the monthly chart, you might see a clear upward trend with a few small dips along the way.
But if you zoom in to the weekly chart, you might see that there are actually several smaller trends within the larger uptrend (or no trend at all). Maybe the stock has been steadily rising for a few weeks, then drops down for a few days, and then rises again.
If you zoom in even further to the daily chart, you might see even more trends or countertrends within the larger trend. And if you’re looking at the hourly or minute charts, you’ll see a whole ‘nother set of fluctuations in price.
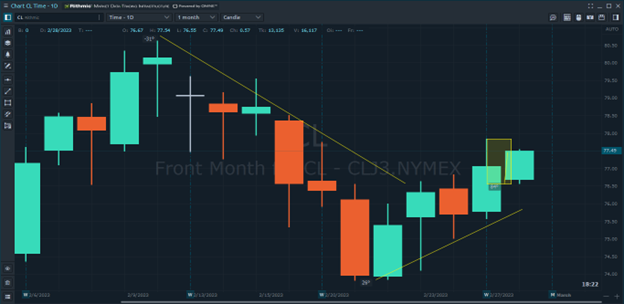
Uptrend on a 1 minute chart (CL)

Sideways rectangle on the 15-minute chart

Uptrend on the 1-hour chart

Downtrend pullback on the Daily chart
The key takeaway here is that there can be many different price trends within a larger trend, depending on the timeframe you’re looking at.
And sometimes, these trends can conflict with one another. This is why it’s important to use multiple timeframes when analyzing futures.
By looking at the big and smaller picture, you can better understand the overall trend and potential trading opportunities. It’s also important to keep in mind that different traders may have different opinions on the trend, depending on the timeframe they’re looking at.
So, it’s always a good idea to do your own research and analysis and not rely solely on the opinions of others.
Most importantly, when trends converge or align with one another, it signals that a trend may be stronger than those whose correlating trends conflict.
Price Action Trading Secret #2 – Follow the Law (of Charts)!
The Law of Charts is a concept developed by trader Joe Ross that helps us identify and understand trends in the market. It’s a simple idea that can be incredibly powerful when used correctly.
- An uptrend = Higher Highs (HH) and Higher Lows (HL)
- A downtrend = Lower Lows (LL) and Lower Highs (LH)
Anything that doesn’t conform to this rule means either a sideways market or a reversal toward the opposite direction.
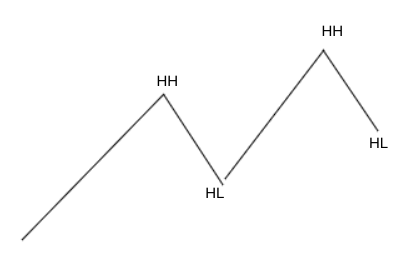
Note: In the image above, the uptrend will continue only if price breaks above the last HH and stays above the last HL. If price fails to break above the HH and falls below the HL, it signals a potential trend reversal.
If the price stays between the HH and HL, it signals a potential sideways market.
The reverse is true in a downtrend.

Live market example:

Let’s recap. When we look at a chart, we can see that prices move up and down in a series of swings. The Law of Charts tells us that if prices are consistently making higher highs and higher lows, we’re in an uptrend.
On the other hand, if prices are making lower lows and lower highs, we’re in a downtrend.
The Law of Charts is important because it helps us to identify the overall direction of the market, which can help us make better trading decisions.
When we know we’re in an uptrend or a downtrend, we can adjust our trading strategy accordingly. For example, in an uptrend, we might look for opportunities to buy the stock, while in a downtrend, we might look for opportunities to sell it.
Overall, the Law of Charts is a simple yet powerful concept that every trader should be familiar with.
By understanding how to identify trends in the market, we can make more informed trading decisions and increase our chances of success.
Price Action Trading Secret #3 – The Ross Hook
Here’s a pattern that’s not too well-known in the trading world—the Ross Hook. A pattern coined by a trader named Joe Ross, the Ross Hook can be a really powerful tool in your trading arsenal.
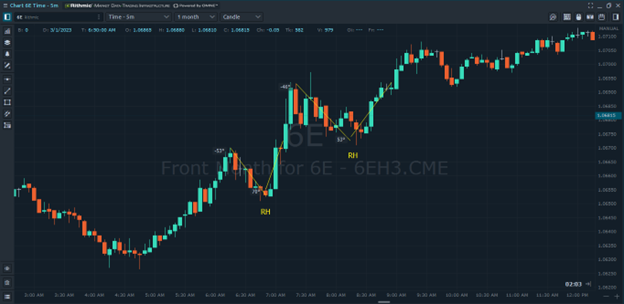

Here’s how it works: it starts with a bullish or bearish trend, followed by a correction.
Then, the price breaks out of that correction in the direction of the original trend. So, for example, if we’re in a bullish trend and we see a correction, the Ross Hook pattern would be when the price breaks out of that correction and continues the bullish trend.
Ross recommends buying (or selling in a downtrend) at the breakout point.
Of course, like any trading strategy, the Ross Hook isn’t a guaranteed win. But if you learn how to use it properly and combine it with other tools and strategies, it can be a really valuable addition to your trading approach.
So, if you’re looking for ways to improve your trading and potentially gain an edge over other traders, consider checking out the Ross Hook pattern.
Price Action Trading Secret #4 – Identify Consolidation Events or Miss the Boat
If an uptrending market fails to make a higher high or higher low, or if a downtrending market fails to make lower lows and lower highs, it’s stuck in a kind of consolidation range (narrow or wide).

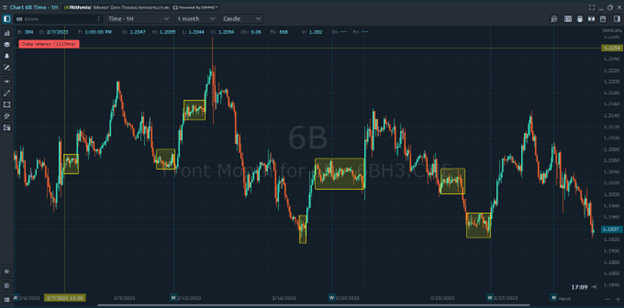
Identifying consolidation is an essential skill. It occurs when the price of an asset bounces up and down within a range, ping-ponging back and forth. Also, note that this can happen in both uptrending and downtrending markets.
Consolidation signals a period of indecision in the market. Traders and investors may be unsure of the asset’s future direction, so the price remains range-bound.
However, consolidation is often seen as a precursor to a breakout, where the price will eventually move up or down and resume its previous trend.
This is the critical moment you are looking for. Hence, being able to anticipate it is key, especially when taking a price action approach. In short, you don’t want to miss this boat.
For traders, the ability to identify consolidation can be useful in several ways. First, it can provide an opportunity to enter a position at a favorable price, as the price is trading in a relatively narrow range.
Additionally, traders can use technical analysis to identify key support and resistance levels within the consolidation pattern, which can provide clues as to which direction the price may break out.
Furthermore, being able to identify consolidation can also help traders manage risk. Suppose a trader is already in a position, and the price begins to consolidate. In that case, they can adjust their stop-loss orders to protect their profits or limit their losses in case of a breakout in the opposite direction.
In short, consolidation is an important market pattern to be aware of as it often signals a period of indecision and a potential upcoming breakout.
By identifying consolidation and interpreting its price action, traders can make more informed trading decisions and better manage their risk.
Price Action Trading Secret #5 – View Support and Resistance From a Supply/Demand Perspective

Let’s revisit the concept of support and resistance. Sounds basic, right? Essentially, support and resistance levels are points on a chart where price action tends to bounce off or stall.
For example, imagine a stock that’s been gradually rising in price. As it goes up, it will eventually hit a point where investors who bought in at a lower price decide to sell and take their profits.
This creates what’s known as a resistance level as the stock struggles to move past that price point.
On the other hand, when a stock’s price falls, there will be a point where buyers see an opportunity to purchase the stock at a discounted price. This creates what’s known as a support level, as the stock tends to bounce back up from that point.
Now, when we talk about turnover between buyers and sellers, we’re essentially talking about the battle between demand and supply. In other words, when the price reaches a certain level, there may be more buyers than sellers, or vice versa.
If there are more buyers, the price will go up; if there are more sellers, the price will go down.
As traders, we can use support and resistance levels to identify potential trade entry and exit points.
For example, if a future contract has repeatedly bounced off a certain support level, we might buy it when it reaches that level, as there’s a good chance it will bounce back up again.
Similarly, if a stock is approaching a resistance level, we might look to sell our position, as it’s likely to struggle to move past that point.
So, while the term “order absorption” might sound a bit technical, the concept of support and resistance is just about understanding the market dynamics of supply and demand.
By identifying these key levels, we can make more informed trading decisions and hopefully turn a profit in the process.
Price Action Trading Secret #6 – Candlestick Patterns Yielding Opposite Results From Expectations
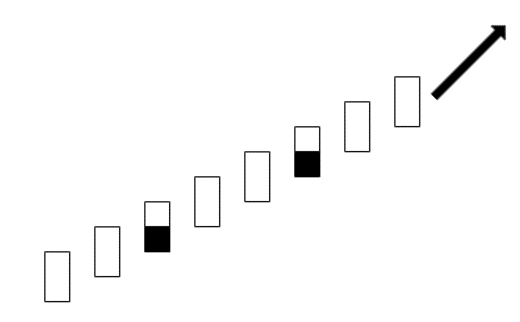
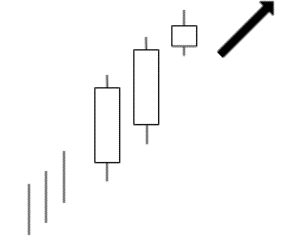
Take a look at these patterns:
This is called “8 New Price Lines,” and it’s a bullish pattern
Here’s another—Deliberation, a bearish reversal pattern
And yet another—Doji Gap Down, a bearish continuation pattern

Here’s the thing…there are plenty more. And this can also be applied to regular chart patterns as well.
There’s a difference between theory and historical outcome. Know the difference and monitor the changes (as all outcome tendencies change over time).
While Japanese candlestick patterns can be helpful in identifying potential market trends and reversals, they are not foolproof and can sometimes produce unexpected results.
For example, a bullish candlestick pattern may indicate that buyers are in control of the market and that prices are likely to rise. However, in some cases, the pattern may not result in a price increase or may even lead to a price decrease.
There are several reasons why Japanese candlestick patterns may yield opposite results from what is expected. One reason is that the market is always changing, and patterns that were once reliable may become less so over time.
Another reason is that market sentiment, and other factors can sometimes override the signals provided by candlestick patterns.
For example, a bullish candlestick pattern may indicate that buyers are in control of the market, but if there is a significant sell-off by large institutional investors, the pattern may be overridden, and prices may decrease.
Similarly, a bearish pattern may indicate that sellers are in control of the market, but if there is a sudden influx of new buyers, the pattern may not result in a price decrease or may even lead to a price increase.
It’s important to remember that candlestick patterns should not be relied on as the sole indicator for making trading decisions. Other factors, such as technical indicators, fundamental analysis, and market sentiment, should also be taken into consideration.
Always be cautious and do your own research before making any trades. And check the stats, as those change over time.
Price Action Trading Secret #7 – Trend Trajectory and Duration Are Critical
A trend’s trajectory can give us important clues about its strength or weakness. Essentially, if a trend is moving steadily in one direction without much interruption, that suggests that the trend is strong and has a good chance of continuing in that direction.
On the other hand, if a trend is choppy or frequently changes direction, that suggests that the trend is weak and may be more likely to reverse.
One way to measure a trend’s strength is to look at the angle of the trendline. If the trendline is steep, that suggests a strong trend, as the price is moving quickly in one direction.
If the trendline is more gradual, that suggests a weaker trend, as the price is moving more slowly and may be more susceptible to reversals.
BUT…
A too steep trend may be more likely to reverse, even if such a reversal is temporary.
This is because a very steep trend may be unsustainable and could be the result of excessive speculation or buying frenzy. Such a trend may eventually run out of steam and reverse as traders take profits or try to exit their positions.
When a trend becomes too steep, it can also become overbought or oversold, which means that it has reached an extreme level that is not sustainable in the long term.
This can trigger a correction or reversal as traders begin to realize that the trend has become overextended.
Therefore, while a steep trend may indicate strength in the short term, it’s important to be cautious and not get too carried away. It’s important to monitor key support and resistance levels and other technical indicators to gauge whether the trend will continue or reverse.
In some cases, it may be wise to take profits or adjust your position size to manage risk and avoid being caught in a potential reversal.
Another way to measure a trend’s strength is to look at its duration. If a trend has been in place for a long time without significant interruptions, that suggests a strong trend, as it has been able to maintain its momentum over an extended period.
If a trend is relatively new or has been interrupted frequently, that suggests a weaker trend, as it hasn’t been able to establish itself as strongly in the market.
Ultimately, it’s important to consider various factors when evaluating a trend’s strength, including its trajectory, angle, duration, and any other relevant market indicators.
By doing so, we can make more informed trading decisions and hopefully capitalize on strong trends while avoiding weak or reversing ones.
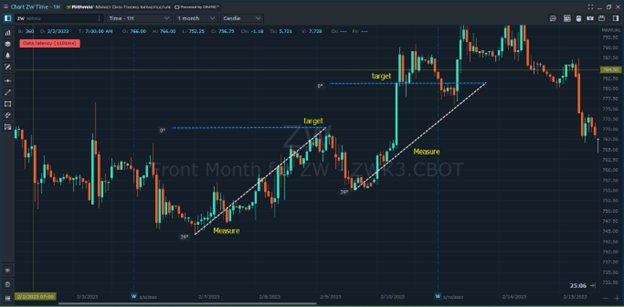
Price Action Trading Secret #8 – Use Measured Moves As a General Tool To Set Up Your Profit Targets
Ever heard of a “measured move”? It’s an essential tool for setting profit targets. It’s based on the principle that after a price breakout, the price tends to travel a distance that is roughly equal to the distance of the initial move.

Now, when it comes to setting profit targets, some traders like to wait for the full 100% measured move trajectory to play out.
However, other traders may start taking profits around 60% to 100% of the move to be safe. This is because there’s always a risk that the price could reverse or move against the trader’s position, resulting in losses.
The key is to find the right balance between taking profits too early and waiting too long.
It’s essential to consider other technical analysis tools and indicators to confirm the trade setup and manage risk effectively.
One way to do this is by using a trailing stop-loss order, which adjusts the stop-loss level as the price moves in the trader’s favor.
This allows traders to lock in profits while giving the trade room to breathe in case of a pullback or a reversal.
Ultimately, using measured moves to set up profit targets can be an effective strategy for traders. However, finding the right balance between taking profits too early and waiting too long is important.
By combining measured moves with other technical analysis tools and indicators and using a trailing stop-loss order, traders can manage their risk effectively and maximize their profits.
Price Action Trading Secret #9 – Know Your Chart Patterns Like the Back of Your Hand, and Then Some
let’s talk about chart patterns for a second. It’s crucial to know them like the back of your hand if you want to make informed trading decisions. But here’s the deal—chart patterns aren’t always as clean as they are in theory.

The broadening top above is similar to the one below, but the angles, support resistance, and shapes won’t always be perfect.

Chart patterns are a visual representation of an asset’s price movement, and they can signal upcoming changes in the price action.
They include patterns like head and shoulders, double tops and bottoms, triangles, and more. However, just knowing the name of a pattern isn’t enough.
It’s also essential to understand its historical statistics of success and failure.
But again, chart patterns are not always “cookie-cutter” clean. Oftentimes, they’re messy, and it’s not always easy to spot them. Even when you do spot a pattern, there’s no guarantee that it will play out as expected.
That’s why it’s sometimes essential to combine chart patterns with other technical indicators to confirm a trade setup.
Another thing to keep in mind is that not all chart patterns work equally well on all assets or timeframes. That’s why it’s critical to test your trading strategies.
Knowing chart patterns and their historical success and failure statistics can be incredibly valuable to traders and investors.
But, remember, they’re not always as clean as they seem in theory. It takes practice, experience, and a combination of technical indicators to spot and confirm a trade setup.
Keep that in mind, and you’ll be on your way to becoming a chart pattern ninja!
Price Action Trading Secret #10 – Don’t Get T-Boned By Economic Data
Okay, here’s something of a hot take for you: traders who swear by technical analysis and completely ignore economic calendars are setting themselves up for a nice little T-bone crash.
Experienced traders tell noobs this all the time, yet we see it happen repeatedly. So, it’s definitely a noob thing.
Look, most of us get it. You’re all about those pretty charts and graphs, and you think you can predict the market’s next move based solely on price action.
But here’s the thing: the market is influenced by a whole host of factors, many of which are scheduled and predictable.
We’ll say it again: “scheduled” and {“predictable” (hear the bells?…ding, ding, ding).
Enter the economic calendar. Yep, the old handy-dandy tool tells you when important economic events are happening, like GDP releases, central bank announcements, and employment reports.
These events can have a major impact on the market, and if you’re not paying attention, you could get blindsided by a sudden market swing that could’ve been anticipated if you’d just looked at the darn calendar.
Here’s an analogy: It’s like driving a car without checking your blind spots. Sure, you can rely on your mirrors and fancy sensors, but if you’re not watching what’s happening around you, you’re liable to get hit by something you never saw coming.
So, to all you TA purists out there: do yourself a favor and check the economic calendar. It might not be as sexy as your Fibonacci retracements or what have you, but it could save you from a nasty collision in the markets.
All the examples above were taken from the Optimus Flow trading platform. Click here for a demo.
For more on How to Analyze Price Action, read our Ultimate Guide to Price Action.
There is a substantial risk of loss in futures trading. Past performance is not indicative of future results. Charting presentations and scenarios are presented as examples only and were prepared with the benefit of hindsight.