This article on Riding a Profitable Trade is the opinion of Optimus Futures.

“Let your profits run, and cut your losers short.” It’s a common maxim; easier said than done. That sounds like a great idea, but how do you do it?
How might you know the optimal time to close a position if it is, indeed, profitable?
Before we discuss how to stay in a trade long enough, it’s important to understand why holding on to winners and cutting off losers is important.
First off, many people believe (including Optimus), markets tend to trend because of the following reasons:
- Fundamental factors drive the long-term prices of an asset
- Prices are not normally distributed but have a so-called “fat tail”: a statistical phenomenon caused by a combination of market fundamentals and supported by human behavior resulting in prices moving in one direction longer than can be explained
- Money moves the markets, and an influx of funds can create trends
- There’s typically is a gradual short covering and unwinding of long positions of time
Retail traders often miss out on capturing the bigger picture when it comes to identifying and following trends. This is typically due to a lack of financial knowledge and/or inadequate trading experience.
The aforementioned saying “Let your profits run, and cut your losers short” refers to the common reality that retail traders often book profits too early and book losses when they get margin calls on their position, or are forced to abandon a trade often in haste.
Trading, is view by many including Optimus, as much as an art as it is a science. Strange as this may sound, it’s a merging of calculation and intuition. Traders often must have a “feel” for the markets while also maintaining objectivity.
Following are a few technical indicators that can help short-term traders attempt to ride the wave when and if their positions move into the green. We will be using each in conjunction with RSI to confirm our view as a filter.
Warning: the following may be a bit “technical,” pun intended, so “hang on” (another pun) as we attempt to demonstrate for you a few ways industry participants use in an effort to “ride a wave”, technically speaking.
MACD-V Volatility Normalized Momentum
This is a version of MACD by analyst Alex Spiroglou, which brings factors in ATR to include volatility in MACD. Below is the S&P 500 mini chart and an explanation of how to use this indicator.
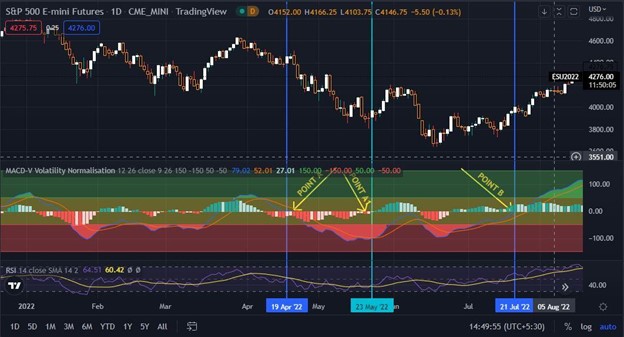
We sell at Point A and buy at Point A1, assumptions being as follows:
- Negative crossover along with breaching to negative territory, RSI confirming the negative bias. To square off, the focus was on MACD and not RSI, and the trend was fairly been captured from 4,424 to 3,943 (Taking an average of open, high, low, and close on both days) a good 10%-11%.
- Another way is to look for overbought and oversold trajectory which is +/- 150, and trade likewise.
Bollinger Bands with Candlestick Patterns
This uses a 2- standard deviation over a 20-DMA and was the brainchild of Sir John Bollinger. Bollinger Bands contract and expand based on volatility in relation to a market’s trend state.
Optimus believes that one reason traders may exit early is that they mistakenly enter sideways markets. This can lead to holding a position to “nowhere” or to whipsaws with no clear trend pattern.
ALSO READ: How to Use Bollinger Bands in Futures Trading
Bollinger Bands can help identify when a trend starts, especially if used alongside RSI and candle stick patterns.

This is Russell 2000 chart. The simple divergence between RSI and Price showed that the trend is about to change.
Indeed, this forecast played out, please keep in mind not all market situations will set up so nicely. Also, a position can be taken as soon as the price crosses the 20-DMA post divergence at 1732, with a stop loss at the lower band and an exit at the overbought zone and/or at the contraction of the band, where we will exit early at the SMA. RSI at 76.9 is vastly overbought, and a move below its 12 SMA could be a sign that the trend is weakening.
In this case, one can close a position at the level of 1990, gaining 255-odd points. But, a drawback with BB is that it has to be used alongside other indicators to give a clearer picture. Again please remember that these charts are being presented with the benefit of hindsight. It can and does take a great deal of experience to identify such circumstances during live market trading conditions.
Using these tools can be one way to help give traders an edge in timing their exits.
Another pattern you can use is the Death Cross and Golden Cross. Both, again in theory, can help you identify long-term trends; the former signals a potential bearish trend while the latter, an uptrend.
The Bottom Line
As technology becomes a bigger part of market analysis and trading, traders must constantly upgrade their approaches to keep pace with the market.
This means you have to monitor every approach you use to gauge its effectiveness under current market circumstances.
Whether you’re dealing with an individual trade or your general approach to analyzing and trading markets, “speed” and “risk management” are key.
In other words, acting fast on trading signals while maintaining an active risk management strategy can help keep you on the right side of the market.
There is a substantial risk of loss in futures trading. Past performance is not indicative of future results. When considering technical analysis please remember educational charts are presented with the benefit of hindsight. Market conditions are always evolving and technical trading theories and approaches may not always work as intended.