Price action is such a popular trading concept because of its simplicity. When it comes to applying price action to charts and making trading decisions based on price formations, there are a handful of principles that can help you make more sophisticated calls and avoid some of the most common pitfalls.
[bctt tweet=”Price action. Can chart formations provide precise or almost precise entries and exits? https://www.optimusfutures.com/blog/price-action-can-chart-formations-provide-precise-or-almost-precise-entries-and-exits/ “]Chart formations vs. Candlesticks
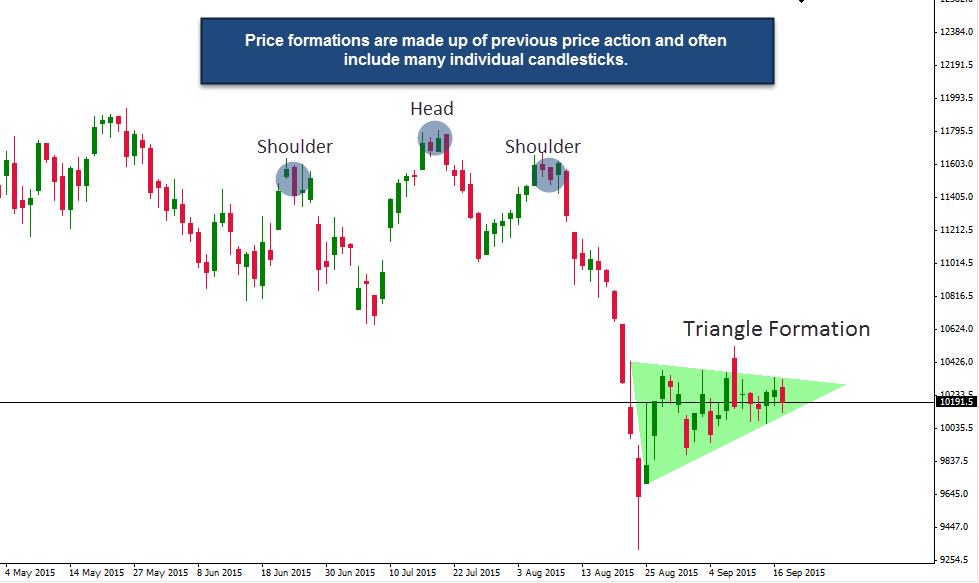
First, we have to be clear what price action and price formations are. Chart formations are made up of many candlesticks or price bars and form certain patterns. On the other hand, candlestick price action traders only focus on a very limited amount of candlesticks to form an opinion – usually not more than 3 candlesticks at a time.
It is important to understand the connection here; an inside bar candlestick formation is made up of a larger candlestick followed by a smaller one, inside the range of the previous candlestick. However, such an inside bar pattern on a Daily time-frame will look like a triangle or wedge chart formation on the lower time-frame. Thus, candlestick and chart formations are essentially the same just viewed differently.

Price action doesn’t predict. Price tells you a story.
Whereas indicator traders are constantly looking for ‘leading’ indicators that can predict what is going to happen next, price action traders follow a different approach.
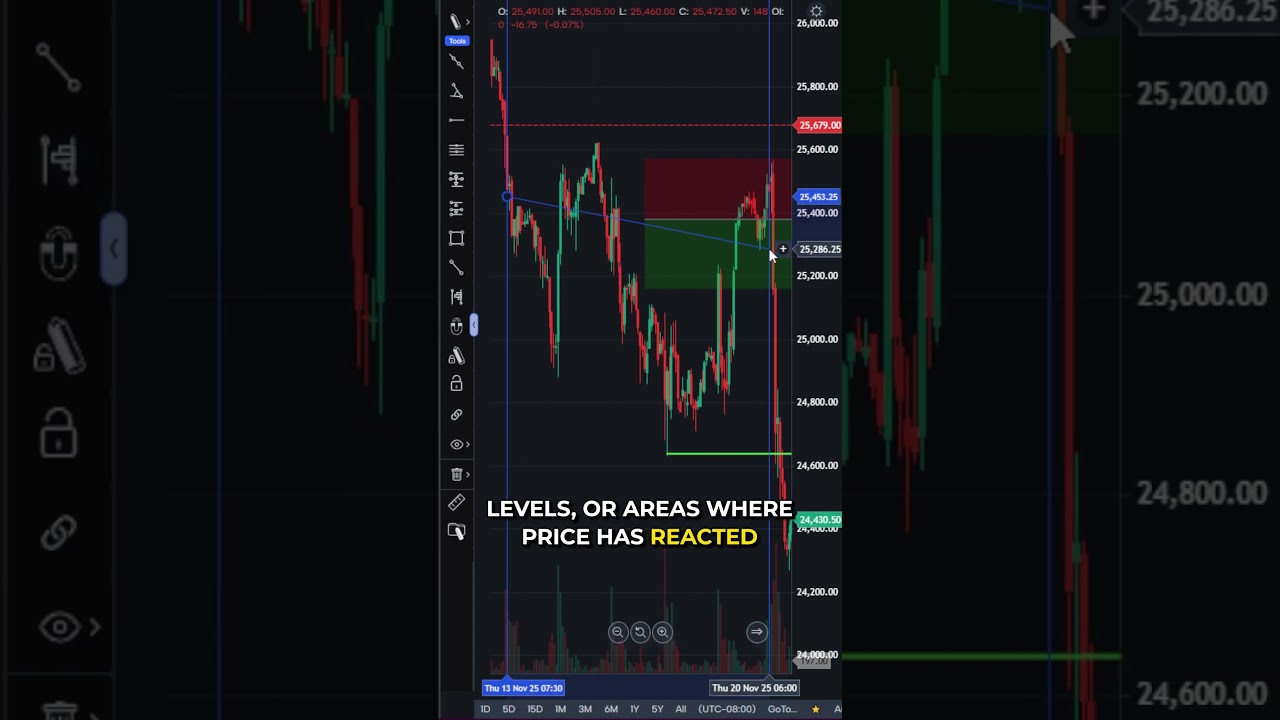
Price action traders anticipate what they see on their charts and don’t try to predict. Traders use price action information to read sentiment from their charts because trading behavior is stored in a price formation. For example, a pinbar (hammer) shows that traders tried to push price higher but then other bearish traders came in and brought price down again. Or, an engulfing candle shows extreme strength when the new candlestick completely engulfs the prior one. And, finally, a double top formation tells you that traders moved price into a certain level twice but they couldn’t find enough buyers to break the level.
Thus, you should not only look for certain patterns or formations on your chart, but put them into context and understand what price action tells you about the underlying behavior or traders moving the markets.
The problem of obvious patterns and their profitability
“Whenever you find yourself on the side of the majority, it is time to pause and reflect.”
– Mark Twain
This quote should be your mantra as a price action trader. A reason why traders often struggle with price action is because following the textbook examples makes you a victim to the experienced traders. Experienced traders always know where the average amateur trader enters a trade and where they place their stops. How? It’s not hard and we show you why.
For example, whenever you see an obvious pinbar candlestick you can be very sure that traders enter on a break of the pinbar and place their stops on the other side. When you see a double top, traders will usually enter right at the level and place their stop on the other side of the resistance level. On a head and shoulders pattern, traders will enter on a pullback to the neckline and place their stop just above the neckline.
If you are a price action trader, you probably know what we are talking about. Next time you see a very obvious pattern on your chart, think where the average trader will put his orders and then observe how price reacts.
What price patterns are made up off
We now have a few tips on how to interpret price formations and patterns more effectively. Instead of just remembering how patterns look and following price action like a template, understanding the true behavior and meaning behind price action can greatly enhance the quality of your trading. Once you understand the underlying dynamics of what drive markets, you are able to make much better trading decisions.
When it comes to making sense of price formations there are 3 principles that help you understand almost any price movement you see on your charts:
1 – The sequence of highs and lows
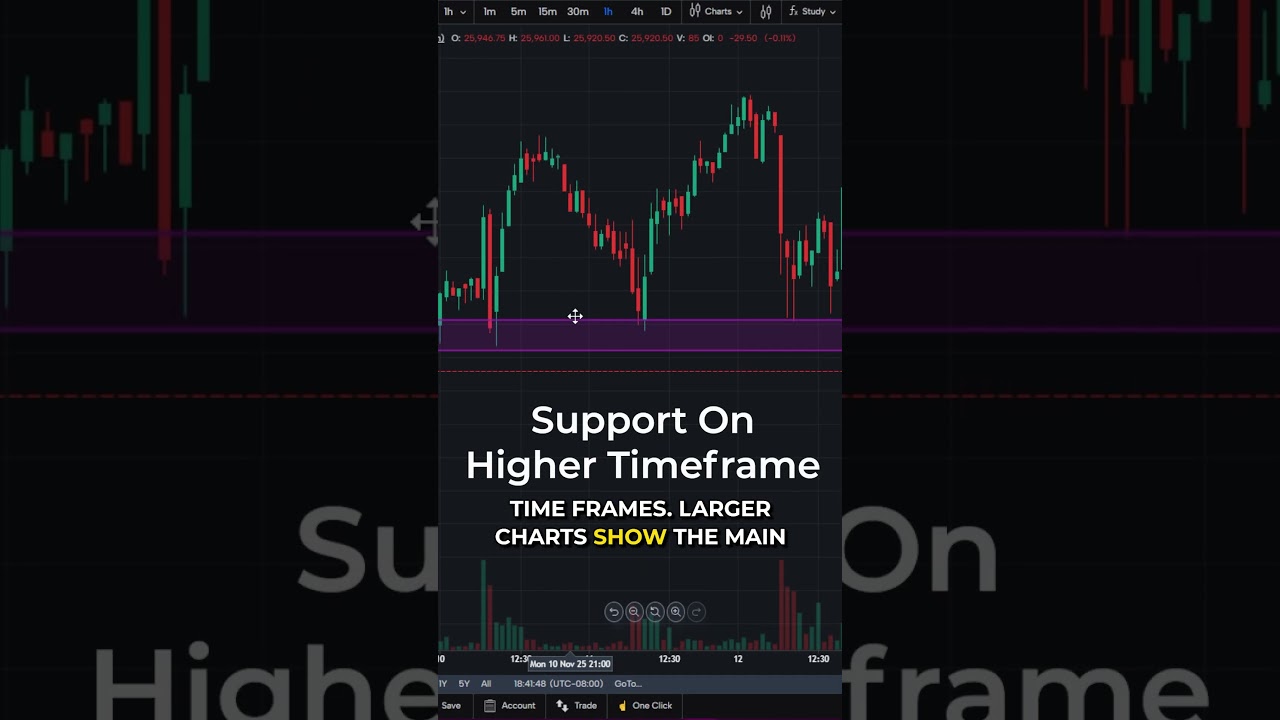
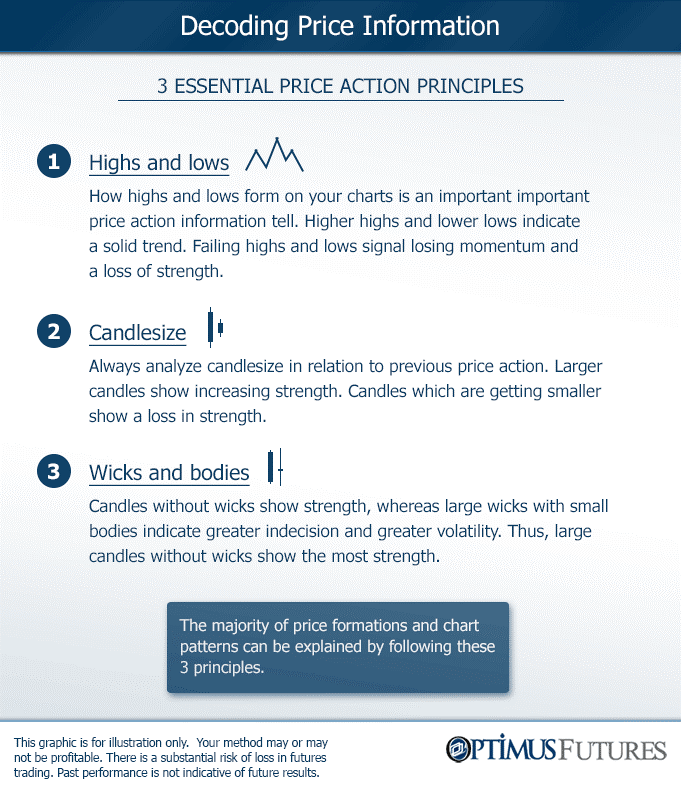
How highs and lows form on your charts is the most used concept in price action and price formation. Remember a healthy trend is defined by higher highs or lower lows and a break of a trend is indicated by lower highs and higher lows.
Thus, a double top shows two highs at the same level where the second high failed to break the prior one, indicating missing strength and conviction behind the move. The head and shoulders pattern shows 2 higher highs followed by a lower high and finally a lower low – a clear reversal pattern indicated by the sequence of highs and lows. Highs and lows will help you understand the majority of price movements and formations.
2 – The strength of a move
How candlesticks form is another important factor to understand price dynamics. Are the candlesticks small and does it take long for the trend to move higher or are the candlesticks large and a large price move occurs with only a few candlesticks? The size of candlesticks, in relation to previous price action is an important tell.
Wicks are another important concept. Can you see a lot of wicks to either side or are the candlesticks mainly made up of the body? Missing wicks and large candles usually show greater strength. On the other hand, candles with long wicks and small bodies show indecision and greater volatility.
3 – Contraction of volatility
This ties in with the previous point. Candlesticks which become smaller in size show a contraction in volatility. This pattern is used in a variety of price formations such as wedges, triangles or pennants.
A contraction and narrowing of volatility eventually results in a breakout. A contraction signals indecision about the current state or the anticipation of an upcoming price movement.
Putting it all together
As you can see, understanding how to read price action can help you significantly really see what is going on on your charts and what traders are up to. But, instead of remembering formations you should aim to understand how to decode patterns and formations by using the 3 principles we described.
There is a substantial risk of loss in futures trading. Past performance is not indicative of future results.