Traders looking for new market opportunities are continuously looking for price tops and bottoms in an attempt to enter the market at the most optimal time. Tops and bottoms are often perceived from news hits with announcements of new highs or lows where traders may start to study the market more closely.
As prices continue to climb or descend, depending on the direction of the trend, traders line up to short a potential top or buy into a potential rally after a dip in price. Most of the time, however, this is done not by hard statistics or metrics, but based on feel or ‘intuition.’ While this strategy may work temporarily, out of sheer luck, the long-term implications of such a strategy tend to be much more erratic as traders place too much emphasis on feel or emotions rather than market signals.
[bctt tweet=”Identifying Directional Reversals Instead of Picking Tops and Bottoms #trading #market $STUDY”]Trying to catch falling prices for long opportunities or attempting to short highs during a momentous uptrend can be futile and lead to frustration. The purpose of this article is to offer an alternative method that may provide more analysis backed options as opposed to reactionary and emotional reversal trades.
An alternative analysis strategy for locating areas of reversal or directional changes first involves defining the larger overall trend. Defining a trend can also be rather difficult, but longer time frame charts such as daily, weekly, and monthly charts can assist in a better perspective of how long a market has been heading in either direction. Trading with the trend as opposed to counter-trend trading can provide some additional peace of mind if micro-analysis is wrong, but the larger macro-analysis of the trend is still applicable.
For example, when seeing a trending market, whether up or down, it may be beneficial to measure how far from a high or low the priced has moved. Often in different markets there can be ranges of movement price has to achieve before determining a new trend direction. This is not always seen on smaller time-frames, so looking at the bigger picture can provide that additional vantage point and data to consider when looking for a trend change.
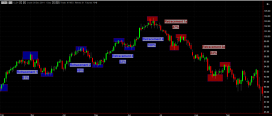
For example, let’s take a look at the December 2014 Crude Oil Futures on a daily time frame:
In the above example, we see retracement percentages in a healthy uptrend. A head and shoulders forms at retracement 4 and it retraces to 100% and eventually continues downward. While this shows the larger price movements for a longer period of time we still see consistent retracements under 65% for a continuation upwards. (charts courtesy of MultiCharts)
When we examine the trend reversal we see again lower percentage retracements and then a continuation in price downwards. As we know from hindsight, this pricing movement continues much further downward than the limited display of this chart.
Please note that while these simple analysis techniques can aid in identifying trend shifts, choosing the retracement areas to calculate is a subjective affair as well. Two traders looking at the same chart may pick different tops and bottoms to calculate their retracements from. The idea is to practice consistency in how you choose your areas on analysis to maintain compatible analysis values. In addition, traders may prefer to use hard pricing numbers rather percentages, or other types of valuations for these retracements. This is not intended to be a comprehensive analysis technique, yet a formidable alternative to simply looking for tops and bottoms based on ‘feel.’
Please be advised that trading futures and options involves substantial risk of loss and is not suitable for all investors. Past performance is not necessarily indicative of future results. This matter is intended as a solicitation to trade.
FMZ-PM-141230
charts courtesy of MultiCharts


