This article on Backtesting Trading Strategies is the opinion of Optimus Futures.
There comes a time in every trader’s development when one accumulates too many trading strategy ideas to test “manually” in a real-time sim environment. That’s just the beginning.
Every strategy can spawn multiple variations. Once you get a handle on your strategy, even the slightest tweak can yield extremely different results. Hence, one strategy becomes two related but separate strategies.
So, if you had five strategies with three tweaks per strategy then you essentially have 25 different strategies whose results can vary considerably. As a trader, you have a responsibility to rank every strategy that might end up seeing the live market.
In short, you need to generate performance stats for each strategy you may one day use.
The only time-efficient solution is to backtest your trading strategies.
What Is Strategy Backtesting?
Backtesting is an evaluation method that allows you to see how well a strategy might have performed in the past. The idea behind backtesting is that its past performance might resemble future results. The keyword here is “might.”
There are many variables that can get in the way, from major shifts in the market environment to the fear of following through with trading rules.
These variables can also make a huge difference. And that’s why you always come across the disclosure that says “past performance doesn’t necessarily indicate future results” because it doesn’t.
BUT, backtesting is the only way to comprehensively and efficiently evaluate a trading strategy in a simulated environment. So, think of it as a requirement but also a “necessary evil” in cases where the results may still differ from live market performance.
Wait, why might it differ from live market results?
The truth is that not all orders will be filled the same way they might (or might not) get filled in a live market. There will be variances. And negative variances can mean costly slippage or, even worse, missed trades.
Also, you may accidentally miss trades or be too afraid to take a trade or you might close trades due to emotions. This is a big part of trading, and it’s virtually absent in a backtesting environment.
You’re wondering if these small differences can make a big difference in a live market. The answer is yes; perhaps more than you may think.
How to Backtest a Trading Strategy
- Pick a trading idea, complete with entry and exit rules.
- Pick a historical period over which to test your strategy.
- Test it on a spreadsheet, or use a forward-testing or automatic backtesting software.
- Gather the results and analyze its performance statistics.
At the very least, you may want to look at the win/loss rate, profit factor, and drawdowns among other stats. The process seems pretty simple though it can also be tedious.
But it’s the most time-efficient way to get a feel for a trading strategy before taking it into the live market.
There are a couple of caveats; very important ones.
3 Factors to Consider When Backtesting Trading Strategies
1. Sample size is critical
Suppose you test a strategy using a week’s worth of data and it produced outstanding performance results. Add another week to it and the results will likely change, for better or worse.
Still, a few weeks of data will not give you a reliable evaluation of your strategy.
Years or even decades of data might give you a more accurate picture. In other words, the larger the sample size, the more realistic the backtesting results.
2. Don’t curve fit your strategy
In grade school, there’s a difference between “studying to pass the test” and “studying the material” to pass the test. The former is narrower and more selective while the latter is more comprehensive and robust.
If you over-optimize your strategy to fit the curves of a given time period, it’s highly unlikely that it may perform just as effectively over another time period.
For instance, if you over-optimize your strategy to a period of non-trending activity, then it’s likely that a trend will through your strategy off balance.
However you tweak your strategy, the more you curve-fit, the less robust it becomes across different market conditions.
3. Fear is never a factor when backtesting
What you’re gaining in backtesting is time. Even if you’re backtesting on an Excel spreadsheet, once you’ve entered your data and conditions, it doesn’t take long to analyze hundreds of trades.
If you’re using a backtesting software, you can get results on hundreds to thousands of trades in a matter of seconds with a click of the mouse.
What’s missing in this process are emotions. You don’t feel the fear, hesitation, or surprise when placing each trade.
And that’s a big disadvantage because these feelings tend to get the best of you when trading manually in a live market (we’ll cover this more thoroughly in the sections to come).
So, now you understand what backtesting is, why it’s important, what to look out for, and its benefits and limitations.
Should you “backtest” or “forward test” your trading strategy?
Backtesting and forward testing are two ways to test your futures trading system in a simulated environment.
For our purposes, we’ll substitute the term “market replay” with forward testing because that’s the name of the software we have available on our trading platform to perform forward testing.
What’s the difference between using Backtesting versus Market Replay software?
Backtesting provides instantaneous results. The software can calculate days to years of trading data in a matter of seconds, giving you performance results almost instantaneously.
You’re virtually giving the computer trading instructions and asking it to place simulated trades across a given time period. Once you press the “go” button, it will crunch all the data and give you the trading results.
The advantage of backtesting is that you can reduce minutes to years to just a few seconds.
Plus, you can select almost any historical period to trade (e.g. an uptrending, downtrending, or flat market).
The disadvantage of backtesting is that you can’t experience any of the emotional distractions and execution errors that happen when trading.
Market Replay allows you to trade a simulated market in real time.
But it’s much more than a “real-time” demo.
With Market Replay, you can pick different historical trading periods. You can speed up time, slow it down, stop it altogether so that you can move bar by bar at your pace, and you can even go backwards in time.
The advantage of Market Replay besides giving you full control of historical market time is that you can get close to experiencing the emotions of each trade, the difficulties of each setup, and the potential execution errors that can happen in a live environment.
The disadvantage of Market Replay is that it’s much more time consuming than a backtest but still more time-efficient than a real-time demo simulation.
As a trader, you might want to try both. So, let’s get to the mechanics of using each software, starting with Market Replay.
How to manually test futures trading strategies with Market Replay
Optimus Futures’ Market Replay software has quite a few features that differentiate it from other backtesting software. Market Replay allows you to…
- Test strategies based on your indicators and drawing tools of choice.
- Test several financial instruments simultaneously.
- Test on an assortment of chart types including Heiken Ashi, Tick, Point & Figure, Price Ranges, and Renko charts.
- Incorporate Depth of Market into your testing.
- Use TPO Profile charts in your tests.
- And finally, you can export your transaction history to do further analysis or testing in Excel.
Here are the steps to take to manually backtest a strategy using Market Replay.
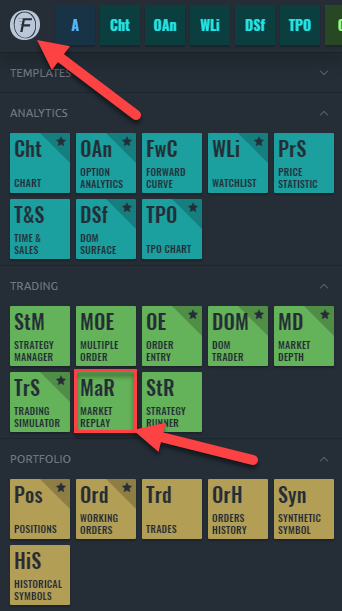
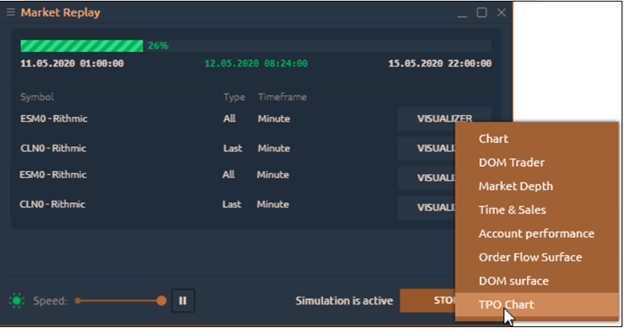
1 – From the main menu, launch Market Replay.
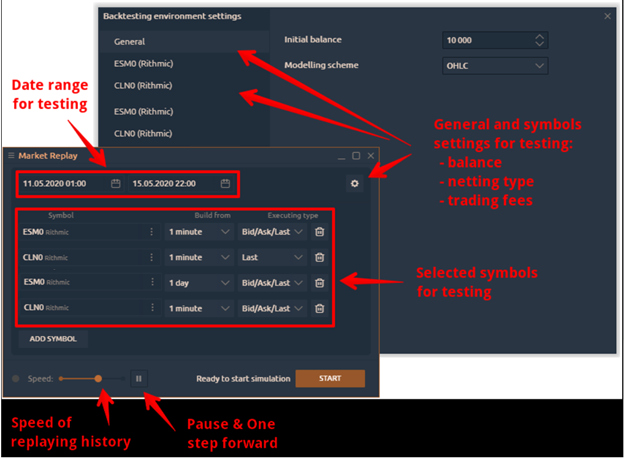
2 – Select a trading instrument for testing > select a timeframe > leave the default data type – Bid/Ask/Last.
3 – Select the testing range > set the initial balance to $10,000 in the module settings.
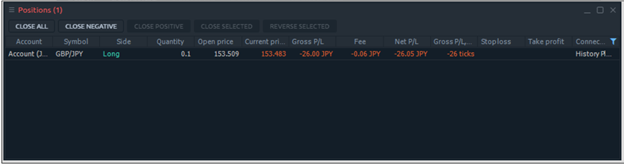
Note that you can open a single position…
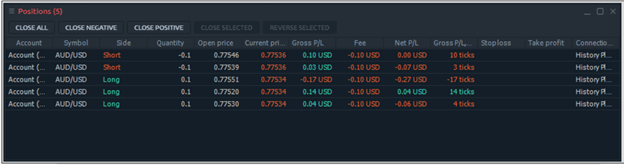
Or multiple positions…
4 – Once you’ve selected your instruments and configured your parameters, click the “Start” button to begin your test. The “Start” button will change to “Stop” once your testing begins. You can also open all the necessary panels for testing by clicking on the “Open panel” button.
5 – You can also change the speed of testing, stop time by pausing, or you can make it move forward by as little as a tick (press F12 or the button “One Step Forward”).
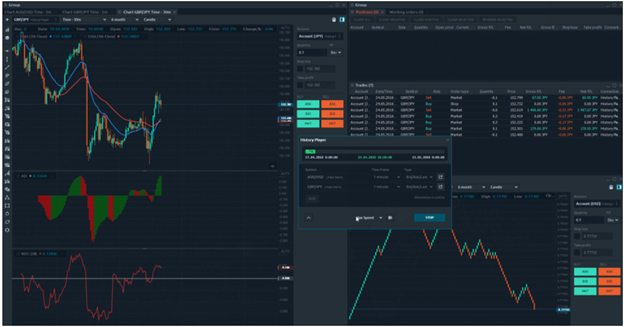
6 – You can also try placing your orders directly on the chart, using various Order Entry windows, or via DOM.
Your trade history and performance results will be displayed on the Trades panel.
Analyzing your Market Replay Results
Once you’ve completed your testing, you will want to analyze the results of your strategy and execution.
The Account info panel will provide you with basic information regarding your trading performance, namely balance, equity, open positions, and profits & loss.

This is where Excel can come in handy. Fortunately, you can upload all of your trades using the export function on the Trades panel.
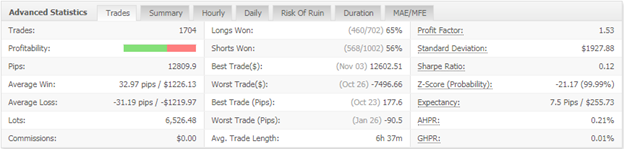
There is so much more to analyzing results. You may want to consider the following:
- Profit factor
- Average profit and loss
- Win rate
- Average and max drawdowns
- Distribution of profits and losses, and more
(Win % x Average Win Size) – (Loss % x Average Loss Size)
Market Replay can provide a semi-realistic environment for you to test your trading stategy. It may be the closest experience you can have to trading a live market.
If you have several strategies you need to test but don’t want to take the time to manually execute your trades, then you might want to consider using backtesting software that can do the job in a matter of seconds.
That’s what we’re going to cover next.
How to Backtest Trading Strategies on Optimus Flow
There are two ways to use this software: Quick backtesting for immediate results, and Interactive backtesting.
We’ll cover the interactive mode before we touch upon the quick backtesting mode.
Interactive Backtesting
Backtesting software can calculate days to months of trading data in a matter of seconds, giving you performance results at almost any speed.
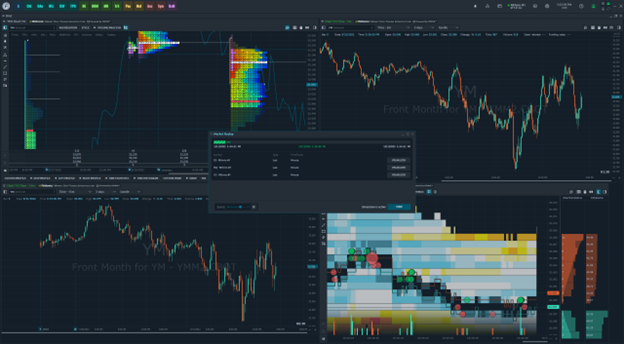
Take a look at your dashboard:
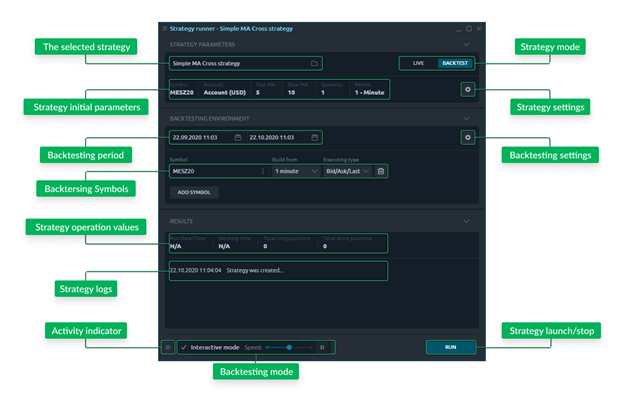
This panel can be broken down into two segments: strategy parameters and results.
Here are the steps you can take to backtest a strategy:
1 – Launch the backtesting panel
2 – Select your strategy
3 – Set up the trading parameters
4 – Press the Run button
A few things to note:
Be sure you’ve switched to Backtest and not Live
The reasons for this are obvious. Also, switching to Backtest will give you an additional block that is specific to the testing environment.
Select your Historical period
Once you’ve made your selection, historical data will be downloaded to your symbol of choice.
- The Build from option allows you to select how the data should be aggregated.
- Ticks provide the most detailed and granular data flow. This setting is perhaps best for high-frequency trading strategies.
- 1-minute aggregation is best for weekly testing. This aggregation also allows you to reduce the historical data amount and speed up the backtesting process.
- 1-day aggregation is the best for testing long-range data (months, years) and seasonal market changes. This might be most preferable for testing a “position trading” or even investing approach.
Environment Settings
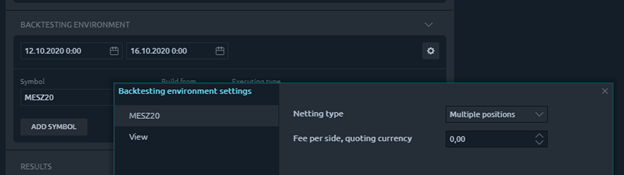
The addition settings screen allows you to set up Exchange or Market-specific parameters to emulate a more accurate environment by specifying your data.
Check out the View tab for general parameters and Per-selected-symbol tabs, for specifying symbol-specific parameters.
- The initial balance field allows you to set the amount of your balance before backtesting.
- The modeling scheme allows you to specify how your quotes are generated, whether you want to use OHLC (open, high, low, and close), Open only, or Close only.
- The netting type is useful when you have multiple positions but only one symbol. If you have several strategies happening all at once on one symbol, netting allows you to see the overall cumulative result in real-time, specifically how much you are in profit or loss.
- The fee per side allows you to see your results with commissions and fees included in each trade.
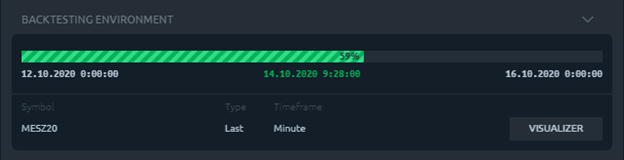
Backtesting Controllers
If you want to visualize the testing process or interact with it while it’s in process, you can use the Interactive mode at the footer of your panel. The speed slider in the interactive mode will allow you to slow down or speed up the testing process.
Backtesting Results
The Visualizer button allows you to track the strategy operation during the history playback. Check out Account performance for your results and the Chart panel which shows you the strategy as it visually unfolds.
If you prefer, you can also visualize the process using Time&Sales, DOM Surface, and TPO Chart, etc.
The New version button near the Run button is an important one to know. This is because you will likely be tweaking your strategy constantly as you fine-tune its performance. Use this button to update your trading code.
Quickly Backtesting Trading Strategies
If you just want to plug in your trading rules, hit a button, and see the results immediately, use the quick backtesting mode.
You can do this by turning off the Interactive mode. This will allow you to test your strategy at maximum speed. The main drawback here is that you won’t be able to see the process, just the results.
Backtesting Trading Strategies Is Both an Art and Science
Backtesting requires its own unique set of skills. Choosing the right historical data, tweaking strategies in a manner that doesn’t curve fit the data, and discerning between backtested results and the real-time experience of trade execution entails a keen sense of how to converge simulation with reality.
Although backtesting is not the same as the live market, it’s probably the closest you will come to the live market before risking your capital.
So, make backtesting an integral part of your trading approach but always be sure to follow it up with what counts most, and that’s trading the live market.
There is a substantial risk of loss in futures trading. Past performance is not indicative of future results.