Turn on the financial news before the market opens, and you’ll see a bunch of headlines, especially on stock market index futures. For instance, you’ve probably heard something like “Dow futures up 200 points” or “Nasdaq futures pointing lower.” Those numbers give you a quick read on how the day might start — if you know how to read stock market futures.
Still, many stock traders see those numbers without knowing what to do with them. These index numbers show you how traders are reacting to the market before the opening bell.
That’s valuable info, but you have to know what to look for and how to interpret it. For example, experienced traders don’t rely on a single number. They look at multiple futures contracts together and compare how the moving parts behave.
In this guide, we’ll walk through how to read stock market futures before the market opens, including the three index futures contracts that matter most—the S&P 500, Dow Jones Industrial Index, and the Nasdaq 100 futures—and we’ll propose a practical routine you can use to make sense of what the market may be hinting at before 9:30 a.m.
What are stock market futures, and why do they matter before the open?
Stock market futures are contracts tied to major market indexes. They trade nearly 24 hours a day, which means traders around the world can react to global news and events while the U.S. markets are largely asleep.
Because these futures trade overnight, they’re usually the first place where you can see prices adjusting to new information. When something hits after the closing bell—like earnings, a Fed comment, geopolitical news—futures tend to move before stocks even have a chance to open.
And that’s why you hear them referenced so often in the early morning. When you see “S&P futures up 0.4%” or “Dow futures down 120 points,” those numbers are just showing where futures are trading relative to yesterday’s (or the previous trading day’s) close.
So, what does this mean for stock traders? It’s an early signal, but not a prediction. It’s a starting point that tells you whether the market is leaning higher, lower, or somewhere in between before trading begins.
The real signal comes from watching how multiple futures contracts move together, not from any single number.
What are the three main index futures stock traders should watch?
The market generally focuses on three main index futures:
- ES (E-mini S&P 500)
- NQ (E-mini Nasdaq-100)
- YM (E-mini Dow Jones)
Each one reflects a different slice of the market. Looking at them together can give you a more complete picture of what’s really happening beneath the surface.
| Index Futures | What it tracks | Most relevant if you trade… |
|---|---|---|
| ES (E-mini S&P 500) | 500 large U.S. companies — broad market representation | SPY, VOO, or most large-cap stocks |
| NQ (E-mini Nasdaq-100) | 100 large non-financial companies and tech-heavy stocks | QQQ, Apple, Nvidia, Microsoft, Amazon, etc. |
| YM (E-mini Dow Jones) | 30 large industrial and blue-chip companies | DIA, Boeing, Caterpillar, Goldman Sachs, etc. |
The ES contract is usually the go-to for a read on the market since it reflects the broadest basket of stocks across multiple sectors.
The Nasdaq futures (NQ) tend to move more aggressively when tech and growth stocks are in play.
The Dow futures (YM) can sometimes highlight moves in industrial or value names. But it’s all the most stable and mature “blue chip” companies in the US market.
Pro Tip: Looking at these side by side is where things start to get interesting.
For example:
- If ES, NQ, and YM are all rising, you’re likely looking at broad market strength.
- If NQ is strong but YM is flat, tech may be doing the heavy lifting.
- If ES is steady but NQ is slipping, it can indicate rotation out of growth.
If you want a deeper breakdown of how traders read ES futures specifically before the open, just check out our related guide: What ES Futures Are Telling You Before 9:30 a.m.
How to read futures before the market opens
Reading stock market futures before the open comes down to a five-step routine: check ES direction first, compare NQ and YM, look for agreement or divergence, identify the overnight catalysts, and then assess the implied open.
Here’s a morning checklist you might want to consider (tweak it to your convenience).
Step 1: Check the direction of ES futures
Check the ES first. It’ll tell you if the broader market is leaning risk-on or risk-off. For example, if ES is up 0.5%, the market is likely opening higher. Maybe it’ll even keep going. If it’s down hard, that’s your bearish warning sign. But don’t stop there.
Step 2: Compare NQ and YM futures
Next, I look at Nasdaq and Dow futures. This is where you start to see what’s actually driving the move.
- Strong NQ with weaker YM → tech leadership
- Strong YM with weaker NQ → rotation into industrial/value
These are just indications, so you’ll have to check other technical and fundamental indicators to get a more accurate read. Remember, this is just the starting point.
Step 3: Look for agreement or divergence
When all three are moving together, that’s a powerful signal. It signals more conviction in the market, whether bullish or bearish.
When they diverge, meaning one’s going up while another is staying put or going down, it means something more nuanced is happening. Maybe it’s hesitation. Maybe it’s rotation. This is where you have to dig deeper to figure out what’s going on.
Step 4: Check overnight catalysts
Before assuming anything, always check if anything that happened overnight might have caused the move.
That could be:
- Economic data
- Earnings
- Fed comments (especially if any of their members gave a speech outside the U.S.)
- Global market moves
It’ll take a little detective work, but if something did happen, you might see traces of it in the overnight index moves.
Step 5: Assess the implied open
There’s only so much information you can take in between waking up and hearing the opening bell. But if you follow what happened overnight with the index futures, you will have enough information to at least get your trading day started.
Example: Pre-market dashboard showing ES, NQ, and YM side by side before the opening bell.
Platforms like Optimus Flow or Optimus Web make this easier by letting you see all three contracts at once, so you can quickly spot whether the market is aligned or mixed.
What does it mean when futures are up?
Futures moving up before the open suggest a bullish start. But that signal matters more when all contracts are in agreement.
If ES, NQ, and YM are all rising, it reflects broader market breadth and participation. In other words, many stocks across several sectors are participating in the rally. This is generally a good sign of a healthy rally.
But experience helps here, as futures don’t always tell the full story.
Before you trust the move, check if you see the following:
- All three contracts are aligned
- The move has held overnight
- There’s a clear (often fundamental) reason behind it
You might be more cautious when:
- One contract is moving against the others
- Overnight activity looks thin
- Major data (like CPI, PPI, or jobs) hasn’t hit yet
For example, a strong futures move at 7:30 a.m. can completely flip after an 8:30 a.m. economic release. This happens frequently, so always keep an eye on the economic calendar.
This is also why you should treat pre-opening futures moves as “context,” not predictions.
What causes big moves in futures overnight?
Large overnight moves usually result from major news that hits outside regular market hours.
The most common drivers are:
- Federal Reserve announcements: Anything from the Fed can move futures quickly, especially if it shifts expectations around rates.
- Major earnings: Companies like Apple, Nvidia, Amazon, or Microsoft can move entire indexes after hours.
- Economic data: Reports released at 8:30 a.m. Eastern can create sharp moves just before the open.
- Global markets: What happens in Europe or Asia overnight often feeds directly into U.S. futures. Will it hold? Sometimes yes, and sometimes no. You have to be ready for the reaction as soon as the opening bell rings.
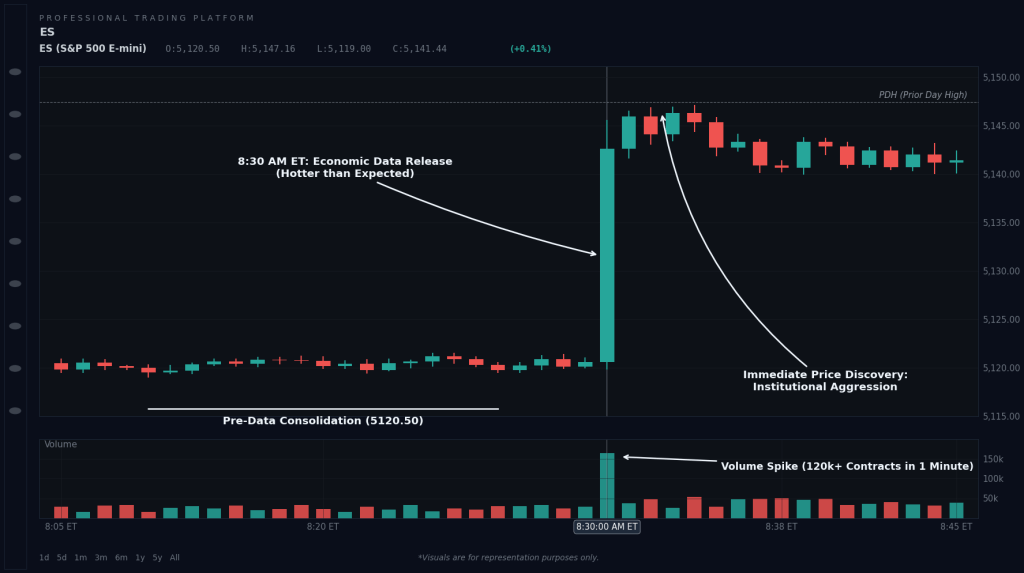
Example: ES futures reacting to a major overnight event.
If you wake up and see ES down 1–2%, the first things to check are: what caused it, whether NQ and YM confirm it, and whether the move is holding.
Pretty simple process, but an important one nevertheless.
What is the stock market’s implied open, and how is it calculated?
The stock market implied open is an estimate of where the market might begin trading, based on current futures prices.
It’s not a formula you need to calculate. Rather, it’s just a translation of futures prices into expected index levels.
For example, if the S&P 500 closed at 5,000 and ES futures suggest 5,020, the market is implying a 20-point higher open.
That’s where headlines like “Dow up 200” or “S&P up 0.4%” come from.
Keep in mind, this number isn’t fixed. Futures move right up until the open, so the implied level can shift in the final minutes.
What is fair value and how does it affect the implied open?
The futures price alone doesn’t give you the actual implied open. There’s a second calculation most stock traders don’t think about — Fair Value.
Fair Value is the spot index price adjusted for two things: the cost of carry (short-term interest rates) and the expected dividends paid out between now and when the futures contract expires. It sounds technical, but you don’t need to calculate it yourself. Most financial news tickers and broker platforms display the Fair Value number alongside the futures price every morning.
Here’s what actually matters. The implied open isn’t determined by the raw futures price — it’s determined by the gap between the futures price and Fair Value.
For example: S&P futures are up 10 points. Sounds bullish. But if Fair Value implies the market should be up 15 points, then futures are actually trailing Fair Value by 5 points. In that case, the market is implied to open lower than Fair Value would predict, which can translate to a weaker open or even a flat-to-negative open at the bell.
That’s why you sometimes see “futures green, stocks opening red.” The raw number increased, but not enough to beat the Fair Value threshold.
Always check both the futures price and the Fair Value number. One without the other is only half the picture.
As a stock trader, how can I use pre-market futures to plan my trading day?
Pre-market futures give you three things you can actually use to plan the day: index direction, sector leadership, and divergence between contracts. Those three together shape your bias before the bell rings.
- Gap-up setups: If futures are strong, you may prepare for a gap-up and look for a continuation. In some cases, depending on the situation, you may prepare to fade setups.
- Sector leadership: If NQ is clearly stronger, you might shift your attention toward tech names.
- Rotation signals: If the Dow is strong while the Nasdaq lags, you might prepare for a rotation in capital flows.
- Risk awareness: Large overnight moves can signal higher volatility, which may prompt adjustments to position sizing or timing. Once the market opens, U.S. traders may agree or disagree with the move, either of which could result in a strong response.
Platforms like Optimus Flow make it easier to track these relationships in real time.
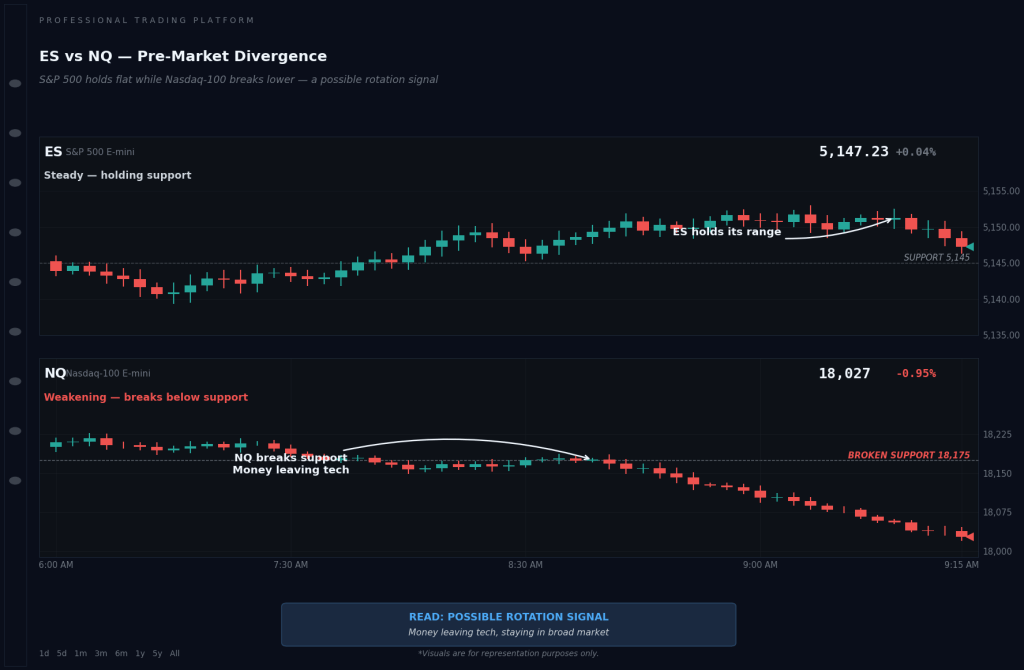
Example: ES holding steady while NQ weakens — a possible rotation signal.
FAQ
Here are a few common FAQs. We covered some of these earlier. But it’s a good opportunity for a recap.
What do stock market futures tell you before the open?
They show how traders are reacting to overnight events before the stock market opens, giving you an early indication of sentiment and potential market direction. Because price discovery happens while the U.S. cash market is closed, futures absorb overnight news before stocks get a chance to react at the open.
Are stock market futures a reliable predictor of the market open?
No. They provide useful context, but they’re not predictions. Market direction can change quickly once stocks begin trading.
What time do stock market futures open on Sunday?
The Sunday-evening session opens at 6:00 p.m. Eastern Time for ES, NQ, and YM, then runs nearly continuously through Friday afternoon with a brief daily maintenance break.
What does it mean when Dow futures are up 200 points?
It suggests the Dow may open about 200 points higher. It’s an “implied open.” However, that can change rather quickly, minutes before the open.
Why are futures green but the market opens red?
Because the implied open is determined by the gap between the futures price and Fair Value, not the raw futures number itself. If futures are up but not as much as Fair Value expects, the market can open weaker than the headline number suggests. The Fair Value section above walks through the full calculation and a worked example.
What is the difference between ES futures and Dow futures?
ES tracks the S&P 500 — 500 large U.S. companies across every sector, giving you broad market representation. YM (Dow futures) tracks just 30 industrial and blue-chip names, which makes it narrower and more concentrated. Because ES covers so much more of the market, it tends to be the more-watched benchmark for overall direction.
How do I check stock market futures before the market opens?
Through trading platforms, broker tools, or financial news sites that display futures data.
Why do futures sometimes reverse right at the open?
Because the stock market, which introduces new volume and liquidity, may disagree with the overnight take on the broader market. It’s telling you that sentiment and demand are shifting against the prevailing near-term trend.
Conclusion
Stock market futures offer one of the earliest reads on overnight sentiment on the U.S. market or economy. After the opening, the market may agree or disagree with the previous night’s moves. Regardless, index futures price moves give you enough context to position yourself for the coming reaction.
Again, the real value of learning how to read stock market futures comes from looking beyond a single number and comparing ES, NQ, and YM together. They won’t predict the market after the opening bell, but they can give you a clearer sense of what kind of environment you’re stepping into before the day begins.
Want to watch these futures signals in real time?
Try the Optimus Futures Free Demo to see how ES, NQ, and YM move before the opening bell. You can also explore more in the Learn Optimus Futures Hub.
Trading futures and options involves substantial risk of loss and is not suitable for all investors. Past performance is not necessarily indicative of future results. The placement of contingent orders by you or your broker, or trading advisor, such as a ‘stop-loss’ or ‘stop-limit’ order, will not necessarily limit your losses to the intended amounts, since market conditions may make it impossible to execute such orders.