This article on How To Avoid A Bull Trap is the opinion of Optimus Futures.
Have you ever bought a futures contract in hopes of a breakout that never materialized? And instead, prices soon start to drop right in front of your face.
But it looked so good. Why did it just all of a sudden break down?
There are many possible reasons, which we’ll explore later on. But we just described something called a bull trap, which is the complete oppositive of the bear trap.
Bull traps happen in bull and bear markets.
And understanding the psychology behind them can serve you well as a trader.
For example, index futures prices have been beaten down in 2022. Traders who try to buy the dip are routinely punished.
A lot of these dip buys turn out to be bull traps.
The best way to avoid them is to get familiar with them and how they work.
Today’s article explores what bull traps are, how they are different from bear traps, and ways to recognize them, along with examples and some tips for avoiding them.
What is a Bull Trap?
We’ve all been there before. It looks like the market bottomed, we step in to buy, and then the price takes another leg lower.
Welcome to the bull trap.
A bull trap occurs when traders expect the market to move higher after a breakout which then fails and sends prices lower. This ‘traps’ bulls into long positions that lose money as the underlying drops further.
Bull traps occur in bear markets when traders are trying to pick bottoms. However, they can appear in bull markets when traders play for breakouts.
Traders are especially susceptible to bull traps in swift market plunges. They know that the reversals are equally as violent. So, they’ll often try to pick off the low in hopes of making a massive gain.
Unfortunately, they’re wrong more often than they’re right.
Bull Traps Vs. Bear Traps
Bear traps typically occur during uptrends. And bull traps usually happen in a downtrend.
But both can be identified with technical tools. And both are driven by the psychology of traders. A bull trap sucks in the longs and drowns them. While a bear trap ropes in the short-sellers and then squeezes them.
The difference between the two is that bull traps put traders into losing long positions while bear straps put traders in short positions.
With bull traps, the trader bets the market moves higher when in fact, it drops further.
With bear traps, the trader bets the market moves lower when in fact, it spikes higher.
Bear traps tend to create more violent reactions when they occur in heavily shorted assets.
You see, when too many traders bet against an asset, you get a setup for a short squeeze. A short squeeze occurs when a bear trap hits traders so bad, the broker forces them to close their positions to stem the bleeding.
To close their positions, traders buy back the stock, sending prices even higher. In turn, this creates a cascade of buying that can send prices up rapidly.
Bull Traps In Action
As noted earlier, the broader stock market hasn’t done well in 2022.
Specifically, the S&P 500 E-Mini Futures have struggled to gain any bullish traction.
Yet, that hasn’t stopped folks from trying to pick the bottom.
In recent trading, after a severe selloff, it appeared that S&P 500 E-Mini Futures bottomed around $4150.
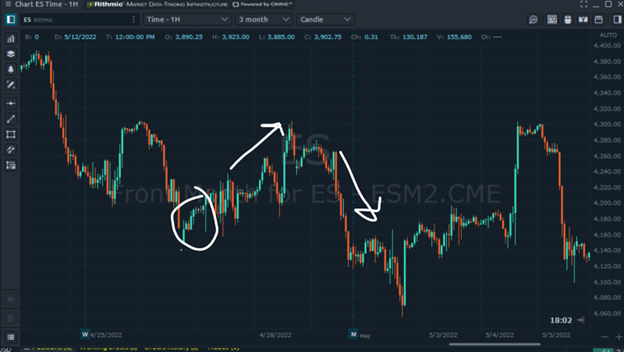
Chart: Courtesy of Optimus Flow Trading Platform
It turns out that this was a bull trap in action.
As futures rallied back towards $4300, bulls hoping for a push higher were trapped in long positions. Futures fell back towards and past the recent low, making another low near $4060.
Given the broader bearish trend in the S&P 500 E-Mini Futures, this is a great example of a bull trap.
And brings us to how we can recognize bull traps.
Recognizing A Bull Trap
First and foremost, bull traps occur most often in bearish trends.
Simply put, they are short-lived rallies that get overwhelmed by the broader and stronger bearish sentime.
Additionally, you want to pay attention to volume.
Typically, volume increases when the underlying futures are making new highs, a strong positive momentum indicator.
If you’d like to learn more about volume profile trading, click here.
Be skeptical if an underlying futures price is making new highs but lower volume than previous sessions.
In a bear market, a bull trap may have the following characteristics:
- Downtrend
- Prices move above resistance on low volume
- Prices move back down below the resistance level
Know Your Levels
One way to avoid getting caught in a bull trap is to know your levels. For example, if you’ve recognized that the futures price has difficulty hurdling over a specific price level, we can assume that is resistance.
Knowing these levels can help you avoid jumping into a trade early or getting in on a false breakout. In many cases, it makes sense to wait for confirmation than to jump into a trade early.
You want to see the asset get and start closing above a recent resistance level on volume to signal an actual reversal.
In the earlier example, the ES never managed to get and stay above the highs around $4300. It likely would have signaled a short-term reversal in the ES if they had.
Other levels traders use include 20-day moving average, 50-day moving average, and 200-day moving average.
Besides knowing key support and resistance levels, it is also helpful to add some momentum tools to your chart overlay, like Bollinger bands. Bollinger bands can give us an idea of how extreme a move is.
Volatility has mean-reverting properties. Lare and fast moves will eventually slow down and normalize.
Another indicator that you may find useful is the Relative Strength Index, which helps identify if futures prices are “overbought or oversold.”
Watch Your Emotions
Irrational behavior can cause prices to overshoot in the futures market. Traders who typically try to play breakouts are often driven by greed.
Sometimes traders will get “FOMO” and chase into a trade because they don’t want to miss out on a potential profit-grabbing opportunity.
You must have an exit plan before you place your trades. Emotions can run wild, and if you don’t have stops or profit targets ready, then you’re more likely to get caught up in the heat of the moment and make a mistake.
At a minimum, we have to exit targets in mind. The first one to take profits. The second is to cut losses. Although it sounds simple, this advice will serve you well.
Trading plans are essential to managing emotions. They provide the structure and strategy for finding setups and executing your trades.
The last thing you want to do is find yourself in a trade, wondering how and when to cut your losses.
Your trading plan should tell you exactly where to put your stops and how to execute them.
Disclaimer: The placement of contingent orders by you or broker, or trading advisor, such as a “stop-loss?? or “stop-limit?? order, will not necessarily limit your losses to the intended amounts, since market conditions may make it impossible to execute such orders.
Final Thoughts
When traders are greedy, they tend to chase trades because they don’t want to miss out. This behavior sometimes creates bull traps.
It’s better to wait for confirmation and have a trading plan if you want to dodge bull traps.
Studying bull and bear traps can also give you ideas on alternative strategies.
If you find that a strategy to be a total loser, consider creating a strategy that takes the exact opposite side of the trade.
Optimus Futures provides all the tools necessary to help you analyze and design the right future trading strategy. Our flagship Optimus Flow platform comes with hundreds of indicators, real-time news feeds, and an automated trading journal.
With dozens of products available, including the latest micro contracts, traders can access more opportunities and optimize their strategies and risk better.
Plus, you can start trading with as little as $500. And your account can be up and running in a matter of hours.
See what Optimus Futures can do for you.
Click here to open your account.
There is a substantial risk of loss in futures trading. Past performance is not indicative of future results.