This article on futures trading chart history is the opinion of Optimus Futures.

One question that many day traders tend to ask is how far back in time they should go to contextualize their trades.
That’s a reasonable question. If you’re trading on, say, a one-minute chart, then yesterday’s trading levels might provide valuable insight toward today’s trade.
But then where does it stop—a week, month, year, or several years?
When is the timescale no longer helpful or valid? For example, how useful is a 5-year old support and resistance when you trade on a 1-minute, 5-minute, or 15-minutes chart?
The answer to this question is not so simple. It depends on multiple factors.
An easy answer to the question above is that it depends on the importance of the technical level.
For example, does the 5-year support represent the highest level in the last bull market?
Does it represent a critical resistance level in the last bear market? As we said, it depends on several factors that can range from fundamental and technical to psychological.
Let’s look at a few factors that you might want to consider.
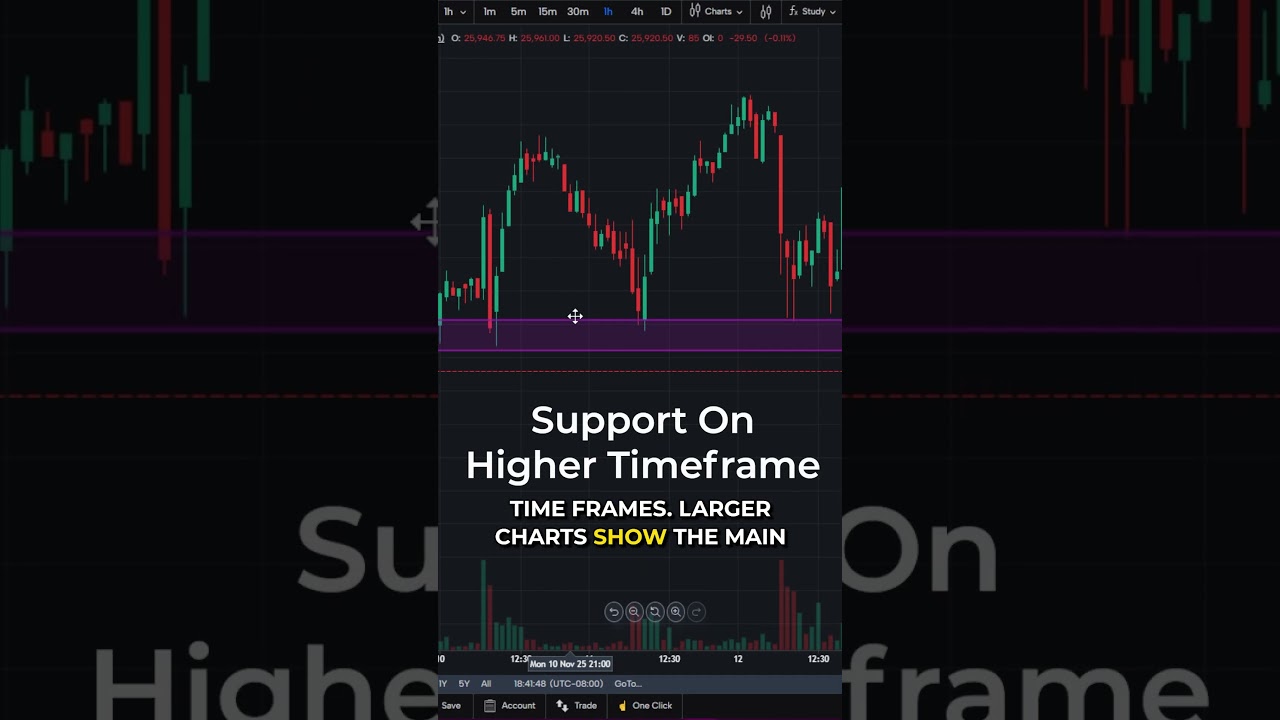
Major support and resistance levels tend to remain active
All-time highs and all-time lows are a no-brainer. Approaching or breaking beyond them will almost always elicit a strong market response.
They are considered “psychological levels.” Even if they don’t have an immediate fundamental connection, approaching an all-time high or low will always create some level of suspense in the markets.
So, if you’re trading on a short-term timeframe, it really helps to know whether your market is approaching any of these psychological levels.
For example, take the 4808.25 all-time high level that MES reached in January.

Assuming that level won’t be approached for a period of years. What do you think might happen once the MES approaches it?
Some traders may believe, depending on the fundamental circumstances, that it might be a strong resistance level, while more bullish traders might believe that it will trigger a stronger move upwards, extending a longer-term uptrend.
In either case, you can expect many buyers and sellers to be entering positions near or at that level. If anything, there will likely be strong volatility once that level is hit.
Figuring out where you are in a trend
We’ve all heard the term, “the trend is your friend.” But which trend, and how far back does it go? Of course, you’ll have to look back in time.
While a day trader may look at the 4-hour or daily chart to identify the trend, a swing trader might look at the weekly chart to get his/her bearings. It all depends on the time frame you happen to be trading.
Looking at the chart below of the MNQ, a swing trader might focus on the bull trend from 2020, in which case it appears like a mere correction in a rising market, especially if you’re viewing a weekly chart.

Here’s the weekly chart. Compare it to the above and you’ll get the idea.
In the chart above, the market appears like it’s slowly plunging, while in the chart below, the market appears to be taking a breather.

From a day trader’s perspective, however, the market appears to be heading straight down.
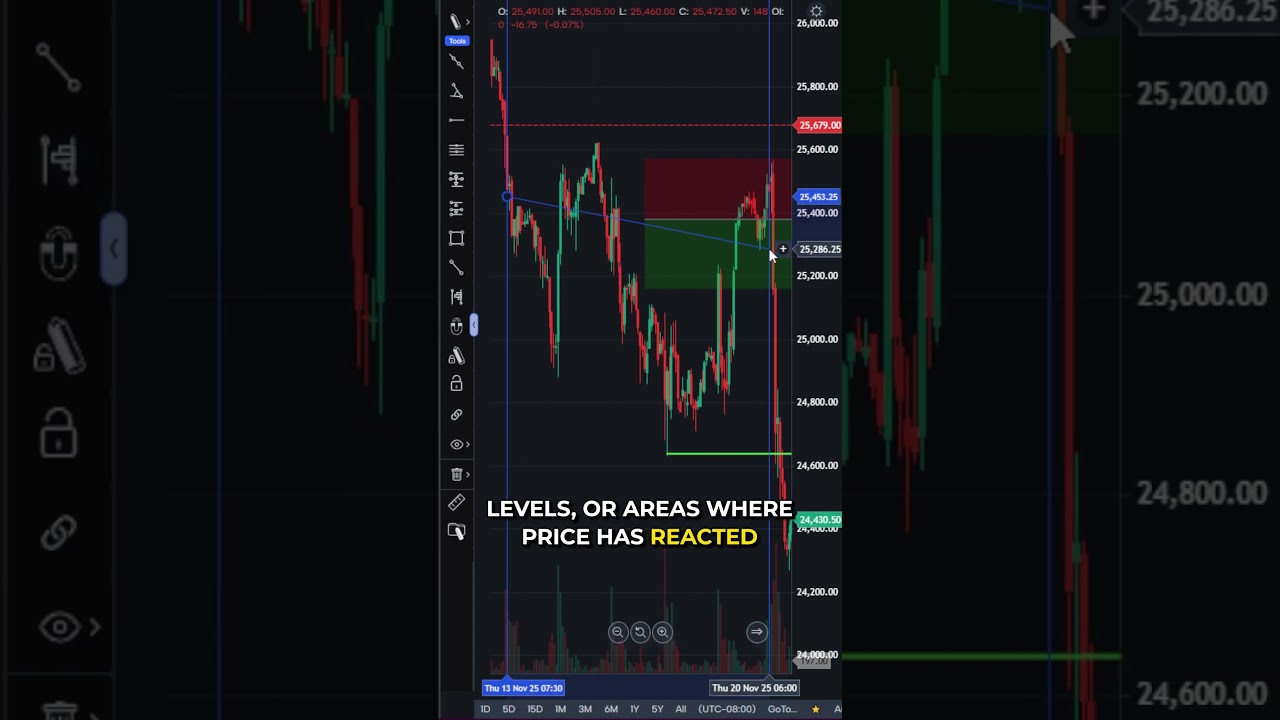
Your trading approach also determines how far back you need to go
Think about this: two day traders might have a different approach to analyzing, trading, or responding to market action. This means that their view of support or resistance will likely differ.
Also, the “time” entailed in day trading can mean seconds to hours, and holding a trade for a couple of minutes is completely different from holding a trade for a few hours.
Both are likely to give equal importance to daily highs and lows, but the intraday levels may mean different things to different traders.
If two day traders can assign different values to support and resistance, imagine how much that might vary once you bring swing traders into the mix.
In short, it all comes down to your strategy and the trading duration it entails.
The two charts below, a 5-minute and 1-hour show the different ranges on the same instrument.

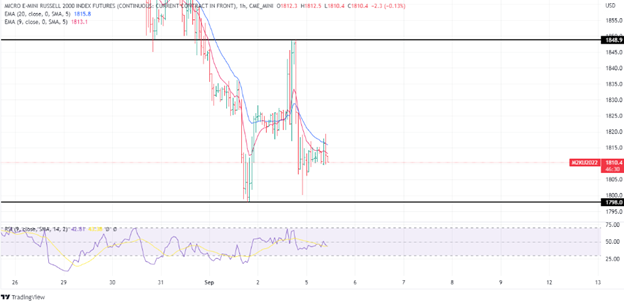
Let’s suppose these two day traders are implementing a mean-reversion strategy to fade resistance and support.
Do you see how radically different their approaches might be even when the difference in time frame is minimal (1-minute and 5-minute)?
The bottom line
The main point here is that there isn’t one definite answer for the question at the top of this article.
Nevertheless, it might help a day trader to sometimes go back to weeks, months, or even years, even if that trader’s strategy is to hold a position for a matter of minutes.
If a chart is a map, then going back can only give you more context as to where you might be. Once you see the data, then you can decide for yourself what’s useful and what’s not.
If you want to view a charting platform that gives you a comprehensive view of market action on several timeframes, check out Optimus Flow | Free for all our customers.
There is a substantial risk of loss in futures trading. Past performance is not indicative of future results. When considering technical analysis please remember educational charts are presented with the benefit of hindsight. Market conditions are always evolving and technical trading theories and approaches may not always work as intended.