
This article on Fibonacci Trading is the opinion of Optimus Futures.
What Is Fibonacci Trading?
If you’ve spent enough time in the active trading world, the name “Fibonacci” will likely have come up several times. There are quite a few trading indicators, techniques, and strategies named after this 13th-century Italian mathematician.
Although Fibonacci himself had nothing to do with these trading approaches, the approaches derive from a few of his concepts; most having to do with his unique form of measurement.
So, to answer the question posed in the title, Fibonacci trading is a trading strategy that employs the use of Fibonacci ratios. Overall, the application may seem pretty basic, but if you look at the market from a “Fib” perspective, you might find that Fibonacci ratios can often be quite helpful and effective.
So, here’s how we’re going to tackle this topic. First, we’re going to explain the basics of Fibonacci ratios and how to interpret them. Next, we’re going to cover a few Fibonacci trading strategies so that you can see how they work in a market context.
Let’s start with the first set of questions: what’s a Fibonacci ratio and how is it used in a trading context?
Fibonacci Ratios in a Trading Context
Before we begin, it’s important for you to know that Fibonacci concepts can lead to several applications across multiple domains.
We’re going to avoid this “rabbit hole” since it’s beyond our purposes. For this introduction, let’s focus mainly on two things: how Fibonacci numbers work, and how the ratios are used in trading.
A Fibonacci number sequence is one that produces a number from adding the last two numbers before it: 0, 1, 1, 2, 3, 5, 8, 13, 21, 34, 55, 89, and so on to infinity.
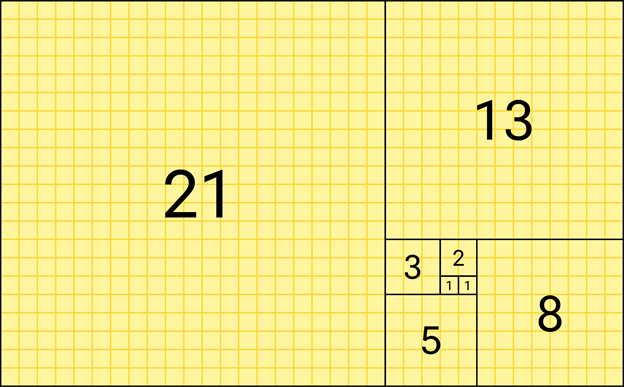
Source: Wikipedia
What’s interesting about Fibonacci ratios is that they can be found in nature, from the smallest building blocks of the universe to the largest celestial bodies.
Here’s a graphic representation of the Fibonacci spiral that’s characteristic of many shapes in nature.
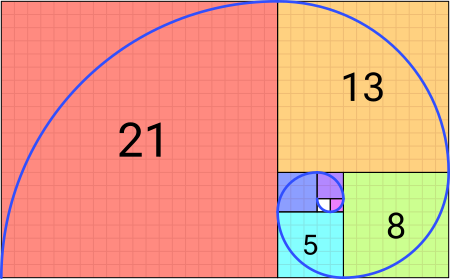
Source: Wikipedia
Do you see seashell shapes, patterns on plants, and countless others that exhibit this golden ratio? What about this example…

Source: Wikipedia
If you take this sequence and break it down into ratios, you will come across the numbers that are used in a technical trading context.
Some traders say that it can be used to unlock potential moves in the financial markets.
Whether this is true or not, enough technical traders respond to Fibs frequently enough that it has become either a self-fulfilling prophecy or a practical framework for timing market entries and exits.
Here’s the Fibonacci ratio sequence: 23.6%, 38.2%, 50%, 61.8%, 78.6%, 100%, 161.8%, 261.8%, 423.6%
Note that 50% is not part of the Fibonacci sequence, but in trading, it’s often appended to this sequence for reasons we’ll explain later.
Okay, so how do you use them?
Two words: retracements and extensions. A retracement is the same as a pullback. It’s what happens when the price reverses from its current direction.
An extension is a projection of where the price might go once it pulls back and then heads back in the original direction, going past its previous “swing high.”
This can sound confusing, so let’s break it all down starting with retracements.
How Do Fibonacci Retracements Work?
Note: Fibonacci retracements can be applied to prices moving higher and lower; to bullish and bearish market scenarios.
We’re going to approach this article from a bullish perspective to simplify things. If you’re looking to apply these concepts to a bearish scenario, then you will have to reverse the concepts.
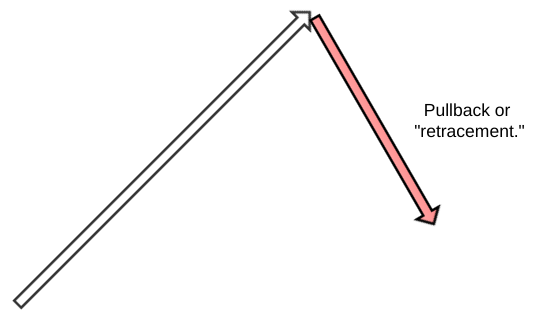
Fibonacci retracements measure the ratio of a pullback.
Let’s suppose the price of an asset moves from a low point to a high point.
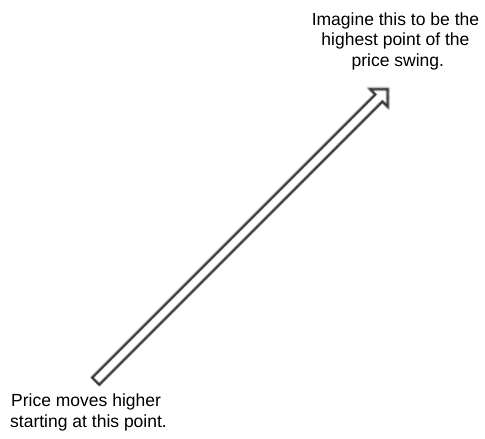
Once the price reverses, it’s considered a pullback, or a “retracement.”
Now, let’s suppose you want to enter a position in the market, add to an existing long position, or place a stop loss somewhere in the retracement.
The big question is WHERE IN THE RETRACEMENT MIGHT BE A FAVORABLE BUY POINT OR SELL POINT?
That’s where Fibs come in handy. Take a look at the image below.
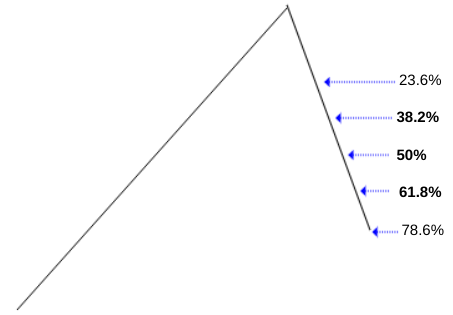
The image illustrates the common buy and sell points using Fib retracements. But why at those price levels? The answer is much simpler than you’d expect, and we’ll cover it later in this series.
For now, just note how difficult it might be to pinpoint these same entries and exit points without the use of Fibonacci’s ratio series.
Disclaimer: The placement of contingent orders by you or broker, or trading advisor, such as a “stop-loss” or “stop-limit” order, will not necessarily limit your losses to the intended amounts, since market conditions may make it impossible to execute such orders.
How Do Fibonacci Extensions Work?
Going back to the last image we looked at, let’s suppose the price goes past the previous swing high.
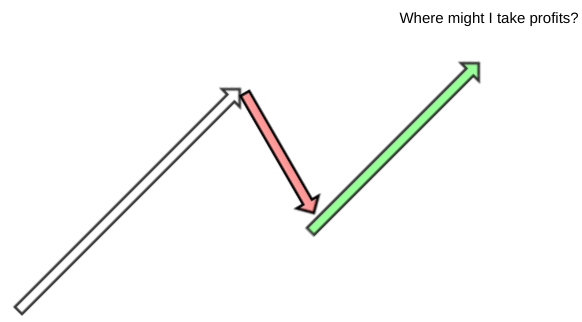
How high might you expect the price to go before taking profit? What are a few strategic price levels that can help you make that decision?
Fibonacci extensions might help you here.
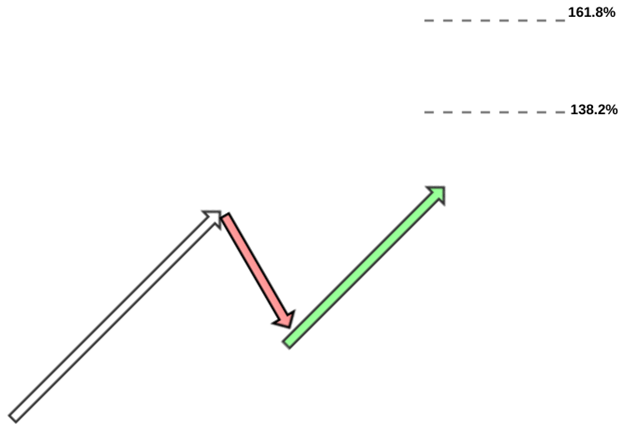
The 138% and 161% levels are among the two most commonly used extensions for taking a profit. There’s no hard rule for these levels.
If you have other technical or fundamental reasons why you might want to take profits at a higher or lower level, then by all means use your judgment.
If anything at all, these Fib extensions can help provide you with a reference point to decide where you might want to close your positions.
We’ll cover these in a strategy context in a separate article.
Fibonacci Ratios in Trading
For now, you should have a clear idea of how Fibonacci ratios are commonly used in trading:
They help you identify potentially favorable entry and exit points by measuring a retracement or by projecting a measured extension.
Now, on to a more detailed explanation of how to interpret Fib retracements.
How to Interpret Fibonacci Levels
When an asset price retraces, we can measure the pullback using these Fibonacci levels.
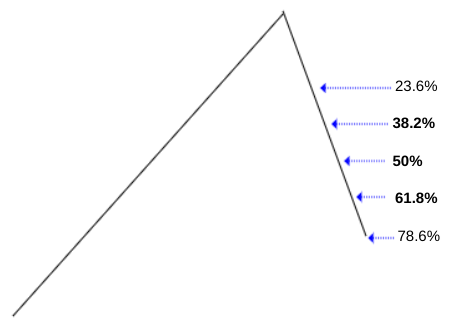
But the three critical Fib retracements are 38.2%, 50%, and 61.8% (see boldface above). Why these levels? Perhaps an anecdotal approach might be the most effective way to explain how to interpret these levels.
Let’s put ourselves in the mind of three traders:
- A – The first is holding a long position
- B – The second trader is looking to enter a long position
- C – The third trader is holding a short position
Price completes an upward swing
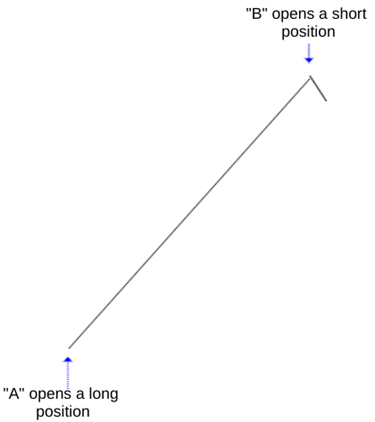
| A (long) | Went long from the start [1] |
| B (waiting to go long) | Still waiting for a good entry point |
| C (short) | Went short right at the top [2] |
Price pulls back to the 23.6% retracement
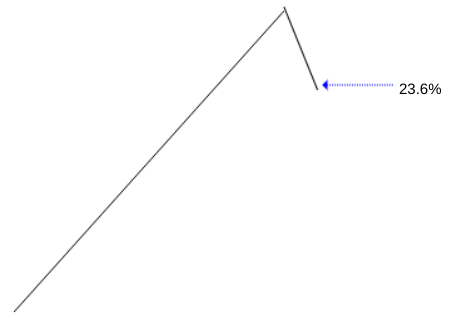
| A (long) | Holding position |
| B (waiting to go long) | Waiting for a deeper pullback |
| C (short) | Holding position; now in the profit zone |
Price pulls back to the 38.2% retracement
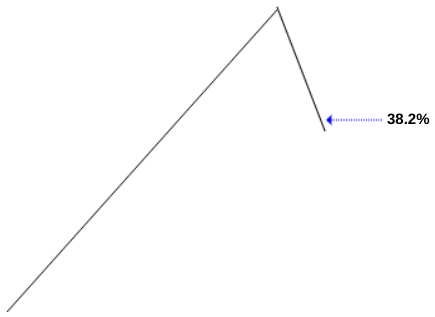
| A (long) | Holding position. |
| B (waiting to go long) | While some traders may enter here, B holds on a little longer. |
| C (short) | Holding position; deeper in the profit zone. |
Price pulls back to the 50% retracement
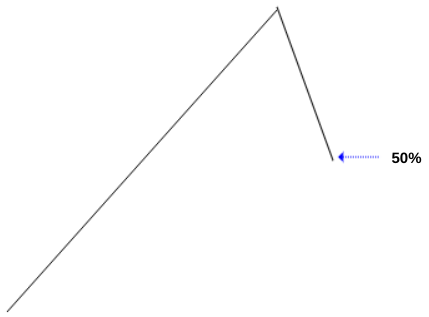
| A (long) | Critical: still holding an unrealized profit but lost 50% off total gain. |
| B (waiting to go long) | May choose full or partial “long” entry at this point; stop loss is placed near the 78.6% retracement level to be safe |
| C (short) | Holding position; unrealized profit growing. |
Important note: at this stage, trader A (bullish) and trader B (bearish) are both holding unrealized gains. One of them will eventually close their positions depending on the direction that price takes from here on out.
Price pulls back to the 61.8% retracement
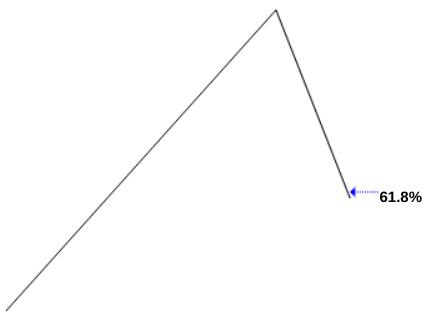
| A (long) | Critical: a move below this might signal that the bullish bias for the long trade may be invalid. Price is to be watched closely. |
| B (waiting to go long) | This might be the most ideal and “last stop” entry point for a long trade; if prices go below this level, a long trade may no longer be valid. |
| C (short) | This level and below might be a reasonable level to begin taking profits. |
Price pulls back to the 78.6% retracement
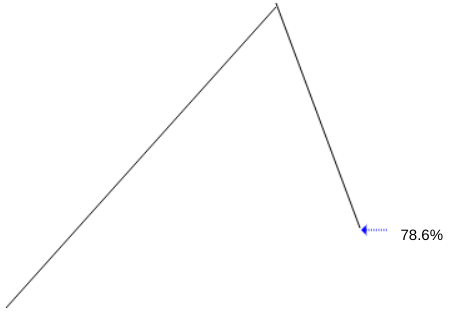
| A (long) | The bullish case is weak and long traders may be tempted to exit their positions starting at this level. |
| B (long) | The bullish case is weak and long traders may be tempted to exit their positions starting at this level. |
| C (short) | Any price at this level and below constitutes a level to begin taking profits. |
There are always exceptions
As with all market activity, there are always exceptions to common thinking.
What we aimed to illustrate here is the psychology behind Fibonacci levels; what traders might be thinking when viewing the price of an asset as it pulls back through various Fibonacci retracement levels.
Hopefully, this gives you some clarity as to how you might interpret and use Fibonacci levels.
In the next section. we will go over a few Fibonacci trading strategies you can add to your trading toolbox.
*Note that we’ll be focusing on uptrending markets for the sake of simplicity (for bearish trades, just reverse the ideas we’re about to cover for short-trading applications).
Fibonacci Trading Strategy 1 – Using Fibonacci Retracements to Scale Positions
When the price of an uptrending asset dips, that decline may present a highly favorable buying opportunity, assuming that the uptrend will continue.
The problem is that it’s impossible to know how far the price will dip before reversing course and heading back in its original direction (assuming that it does).
This is where Fibonacci retracements can come in handy, especially if there is no clear support and resistance to help you estimate a potential turning point: Fib retracements can provide you with a set of objective points to either enter a market or scale a position.
The problem with using Fibs to time market entries
If you read the first part of this strategy guide, then you already know that the 50%, and the 61.8% all provide favorable to ideal market entry points.
But what if the price never retraces that far and instead reverses on the 38.2% level?
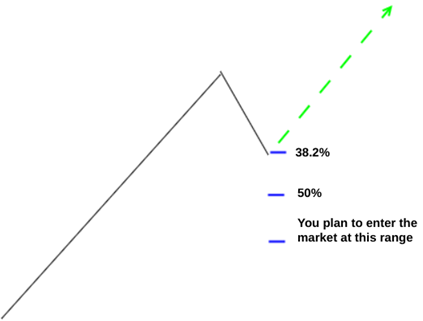 In the case illustrated above, you just missed a trading opportunity.
The same thing could happen if you’re waiting for price either to hit the 50% or 61.8% retracement level. Price can reverse above those levels, only to miss your entry order.
One way to solve this dilemma is to enter a trade early, like at the 38.2% retracement line. But there’s a problem with that too…
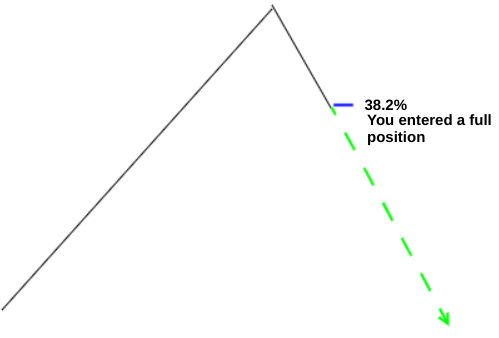
So, how might you enter a trade without risking too much early on in the trade?
The answer is to “fractionalize” and scale in your position. And this is where trading Micro E-Mini futures contracts (“micros”) can really help.
Micros are a tenth of a standard e-mini contract. Let’s suppose that a full position for you in the e-mini S&P futures (ES) is one standard e-mini contract. Here’s one way to fractionalize your position.
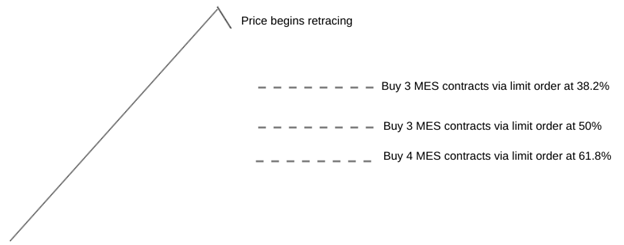
Place a stop loss at your discretion. You may place it below the beginning of the most recent swing high, or closer to the bottom of the initial leg up such as the 80% retracement level.
The benefits of scaling into a position
If your trade doesn’t pan out, scaling by fractionalizing your position, you may absorb less of a loss than entering higher with a full position.
Likewise, if price were to reverse after the first or second buy point (38.2% or 50%), you would still have a fraction of a position in the trade (which you can add on to later).
Fibonacci Trading Strategy 2 – Using a Measured Move to Forecast Profit Targets
Let’s suppose you entered a trade at the 50% Fibonacci retracement level.
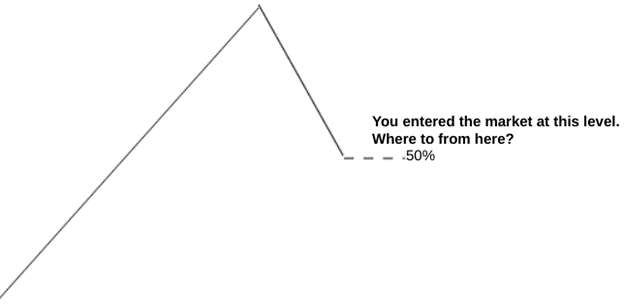
So, now what? Where’s your profit target?
Sometimes, traders will find a previous resistance level to guide their profit targets. That won’t work, however, if price is at an all-time high, as there’s no historical resistance to guide you.
You can always use the Fib extension levels of 138.2% and 161.8% to mark your targets. But here’s something that many traders often use. It’s called a “measured move.”
A measured move is a trading concept that postulates the next leg of a swing will be roughly equal to the previous leg.
To use this concept, measure the previous leg and add the height of the leg to the low of the retracement.
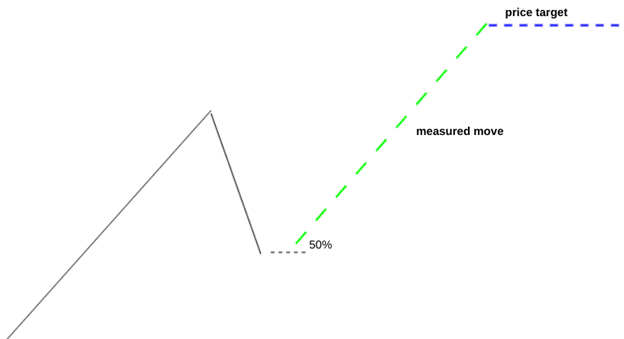
Do you see what the diagram is doing? It’s projecting the same height of the leg (see green dotted lines) from the low the swing (50% Fib retracement) and determining a potential price target.
Here’s what it looks like in a live market situation.
Micro E-Mini Dow (MYM) – Daily – May 28, – September 9, 2021
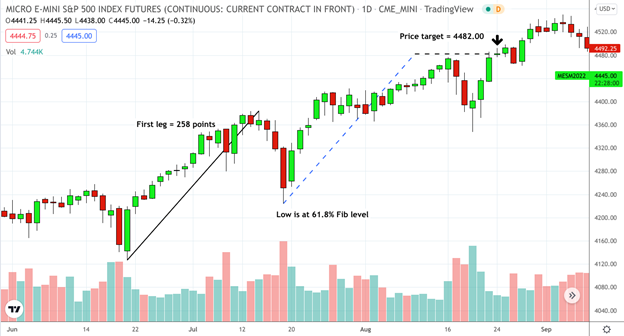
Notice how price approached the target at 4482.00 before pulling back slightly. These measures are “approximations.” Don’t expect “perfect” setups or targets.
Like all chart patterns, you can’t rely on measured move price targets to repeat the same outcome each time you attempt this trade.
But it does give you a reference point from which you can “manage” your trade. Where and when you decide to close your position is 100% up to you.
Caveat: measured moves tend to perform better with a deeper retracement, namely, a 50% and 61.8% retracement.
Shallow pullbacks may not have the momentum necessary for a measured move to follow through. Too deep a retracement, like 78% or more, tends to have lost the bullish momentum necessary for price to keep moving higher.
These caveats aren’t rules set in stone. However, they may be practical “rules of thumb” to keep in mind when managing a trade.
Fibonacci Trading Strategy 3 – Using Fibonacci Time Zones to Anticipate Turning Points
Do market swings have identifiable rhythms? Take a look below.
MES – Daily – May 19 to August 25, 2021
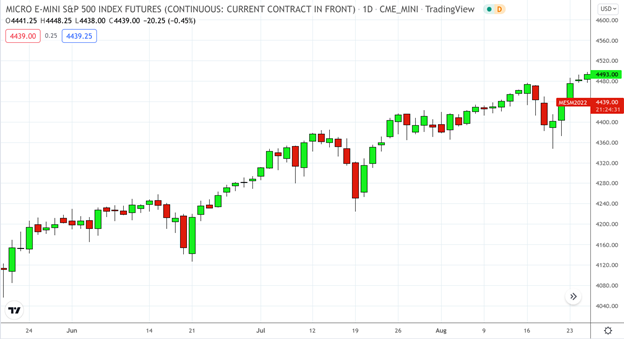
Now, look at it again, this time counting the number of sessions from high to low.
MES – Daily – May 19 to August 25, 2021
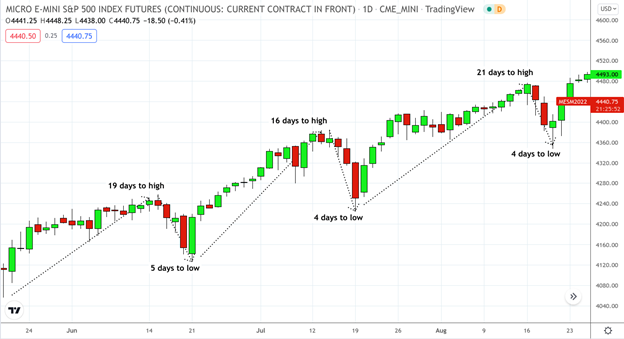
Are these “consistencies” pure coincidence? The answer can be yes, no, or maybe. In short, nobody knows for sure.
But sometimes we do see clear rhythmic consistencies accompanying market swings.
What causes them and why they appear at certain times and not others is all a matter of speculation.
In other words, you can’t really predict market turning points using any form of “rhythmological” method, but you can use a rhythm-based approach to “anticipate” potential turning points.
To be clear, you might not want to rely on these approaches but you can use them to plot potential setups: IF the market turns here, THEN I’ll do this; IF it turns before or after the anticipated point, THEN I’ll respond by doing any of the following actions.
Counting the swings is one simple way to do this. But since we’re on the topic of Fibonacci strategies, there is a Fib-based indicator that has its own unique way of anticipating turning points.
It’s called Fibonacci Time Zones.
Fibonacci time zones are vertical lines that indicate potential areas where swing highs or lows can occur.
These zones are based on a simple Fibonacci sequence: 0, 1, 1, 2, 3, 5, 8.
In an uptrending market, the 0 point is plotted at the start of a swing high, and the 1 point marks the end of that same swing high.
So, in order to plot the entire time zone, you have to measure a significant swing high (or swing low if you’re going short).
Here’s what it looks like.
CL – Daily – February 15 – April 20, 2022
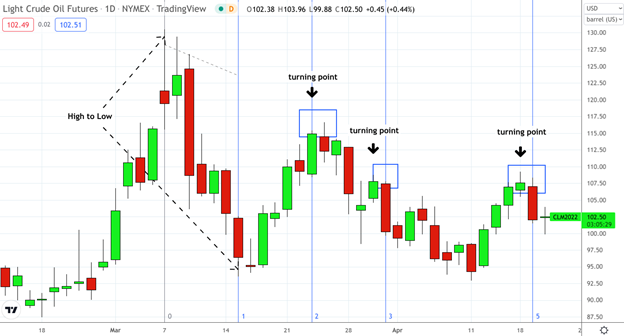
You can see where the turning points matched or got close to the time zones. But is it pure coincidence?
Here’s another chart.
MNQ – Daily – September 8, 2021 – April 20, 2022

Not super accurate. And the turning points that matched the Fib zones seemed quite insignificant.
But is this really about making predictions or mapping out a context of probable events? If you approached it from a context perspective, how might Fibonacci time zones help your trading?
Would it add unnecessary complexity to your trading or would it add simplicity to the price volatility and the directions it can imply?
The answer is: that it depends on the individual trader and his or her approach to the markets. Understanding where the trend is going can also be critical to the type of position you open when using Fibonacci time zones.
The Takeaway
There are many strategies you can use to trade the market. We presented three Fibonacci-based strategies to get you thinking.
If any of them resonate with your trading mindset or your strategies, then be sure to customize them in a way that best suits your trading approach and your risk tolerance levels.
Disclaimer: There is a substantial risk of loss in futures trading. Past performance is not indicative of future results. Trade only with your risk capital.
