When it comes to exiting trades, some traders may have room for improvement in their approach and strategy. In this article we highlight some simple, yet often overlooked, price action principles that can help you understand when a trend is over and likely to reverse.
Exiting Trades using Wicks – Candlestick Rejections
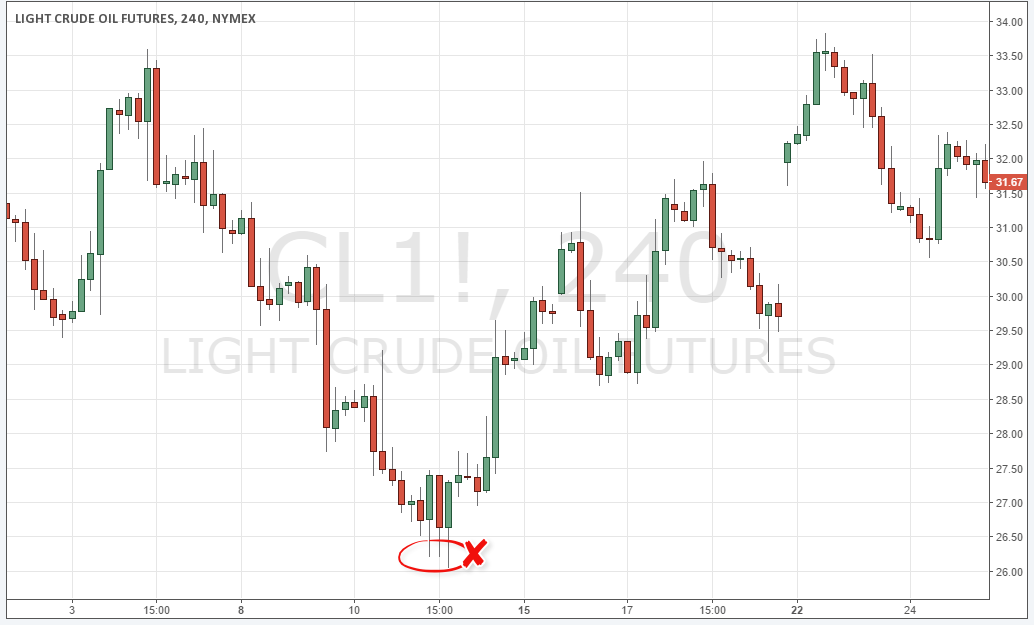
Wicks after a long trending phase may point out that the trend is losing strength. In the screenshot below you can see how multiple wicks to the downside after the strong sell-off foreshadowed the bullish reversal.
The wicks show that sellers tried to move price lower to continue the downtrend, but sellers didn’t have enough power and buyers stepped it to absorb all sell orders and keep price up. Finally, sellers gave up completely and buyers moved price higher.
Charts courtesy of TradingView
Exiting Trades using the Outside Bar
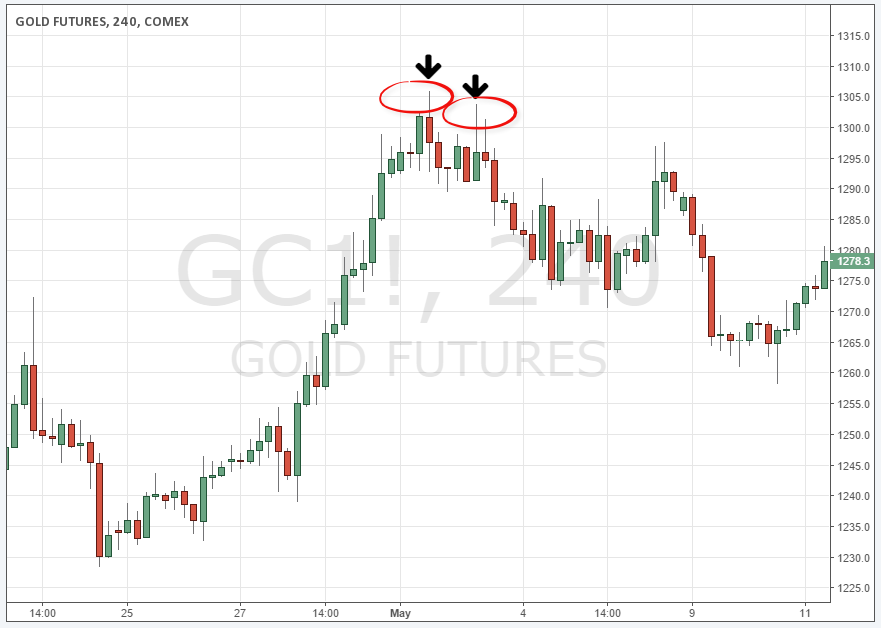
The outside bar is a great 3-candlestick price pattern and it can offer reliable information if a trader can analyze it in the correct context. An outside bar is a candlestick that completely covers the previous candlestick. The final signal then comes after the outside bar, when price moves into the direction of the outside bar.
In the screenshot below, you can see that the first arrow points to a bearish outside bar that completely covers the previous bullish candle. This shows that buyers tried to move price higher but were rejected and sellers drove price lower. The second arrow highlights a candlestick with a long wick which, as we learned previously, shows rejection as well. Together, those two clues could have provided information to exit any long trades very close to the top.
Charts courtesy of TradingView
Exiting Trades using the Rounding Price Formation
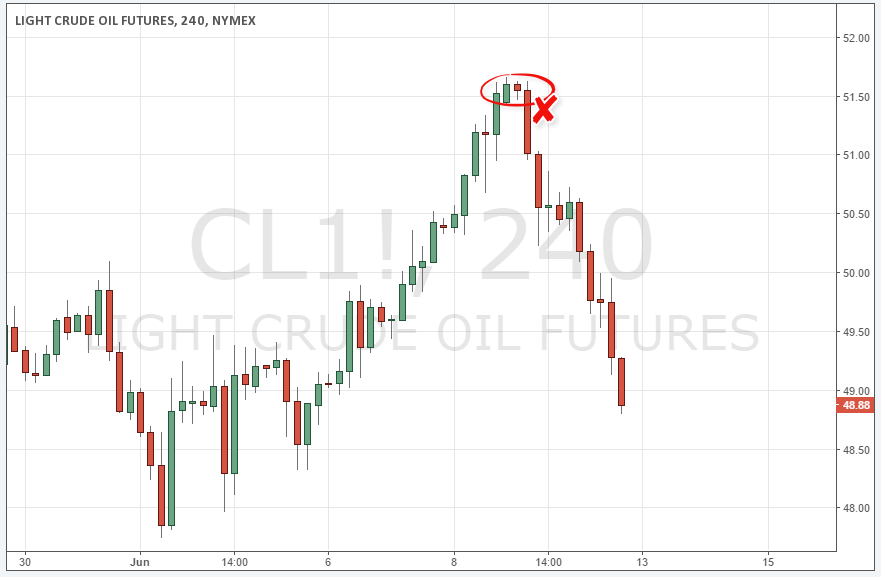
When you see that a trend is showing signs of rounding-off, it is usually a signal to exit positions into the direction of the trend. After the long rally price showed a clear rounding-off in price structure in the screenshot below. During such a price scenario, you can usually see that the candlesticks become smaller and smaller as well, showing the fading interest of buyers in the trend. In the scenario below, you can even see a candle with a very long rejection wick that further confirmed the end to the uptrend.
Charts Courtesy of TradingView
Exiting Trades using the Inside bar
The inside bar can either be a trend continuation or a reversal pattern and, similar to the outside bar pattern, it’s also a 3 candle pattern: the inside bar is the second candle and it falls completely into the previous candle. The third candle is then the confirmation candle when price breaks out above or below the inside bar.
The screenshot below shows the small inside bar that completely falls into the previous green bar and it signaled that buyers were not pushing price higher anymore. The following candle was then a huge bearish candle that then foreshadowed the upcoming downtrend.
An inside bar is usually not enough to exit a trade, but it serves as a warning signal. The direction of the candle after the inside bar then shows where price is likely to go.
Charts Courtesy of TradingView
Exiting Trades using the Double Bottoms
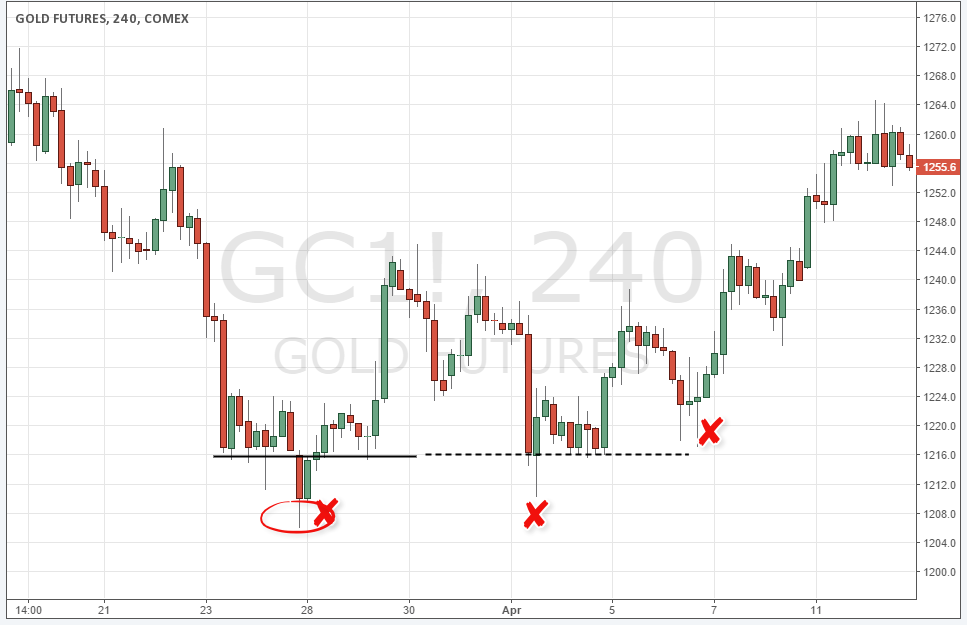
Double bottoms and tops are great contextual and longer term patterns that provide a provide multiple opportunities to get out of existing trades for potentially a good price. A double bottom shows that price tried multiple times to break a support level but lacked the momentum and the seller support to make it through the level. If you are in a short trade and see that price is struggling with a double bottom, it’s usually always a good idea to exit your trade and avoid giving back profits.
The screenshot below shows a scenario where the trader was given multiple clues to exit his short trade. The first break below the low was immediately rejected, then price came back to make the double bottom and left a long wick which again shows rejection and after the double bottom price even made a higher high with long wicks which showed that sellers were completely leaving the market.
Charts Courtesy of TradingView
Of course, price won’t always give you clear signals to exit your existing trades, but once you start paying more attention to those subtle clues you should be able in our opinion to make much better trading decisions.
There is a substantial risk of loss in futures trading. Past performance is not indicative of futures results.

