The article on Breakout Trading is the opinion of Optimus Futures, LLC.
- Breakout trading involves capitalizing on price movements beyond established support or resistance levels.
- While this strategy can be profitable, it’s essential to differentiate between genuine breakouts and false ones.
- Effective breakout trading requires understanding market drivers, utilizing historical data, and implementing rigorous risk management techniques.
Market prices fluctuate based on supply and demand. It’s these fluctuations in price that make it possible for speculators to take one side or another to seek profit.
However, there are certain price levels at which bulls and bears strongly disagree. These are known as support and resistance levels. The bulls believe demand is greater than supply, while the bearish trader see the opposite scenario.
Ultimately, one side will overpower the other. And this is where you find explosive moves in the form of a price breakout, either up or down.
What is a Breakout?
In the financial markets, a price breakout is a phenomenon in which the price of an asset moves beyond a support or resistance level. One side, either the buyers or sellers, overpower the other, causing prices to move, often in volatile fashion.
Bullish and Bearish Breakouts
Breakouts followed by non-trending price action can’t be viewed as a legitimate breakout. The price action to follow has to go either up or down, leading to an uptrend or downtrend. If it falls back to the pre-breakout levels, it’s a false or failed breakout.
- A bullish breakout takes place when the price moves upwards beyond a resistance level. This suggests a new or continuing uptrend. And often, resistance, once breached, tends to transform into a new support level.
- A bearish breakout happens when the price drops below a support level, indicating a new or continued downtrend. Likewise, the previous support level might then act as a new level of resistance.
What Drives Breakouts?
There are several factors that can drive price breakouts. But three of the primary drivers are:
Fundamental Factors: Important economic news or events can drive prices to break established levels. This could include anything from earnings reports to macroeconomic data releases.
Technical Factors: Prices can also break out on technicals. For example, if many traders have placed stop orders at a particular price level, a break beyond that level can cause a rapid chain reaction of trades, pushing prices well beyond a support or resistance.
Market Psychology: As they say, the market has memory. And when a collective mindset of market participants focus on specific levels of support and resistance, sometimes it can lead to breakouts. If a majority believes a certain price level is significant, their collective actions going against that level can cause a volatile breakout.
Why Breakouts Make An Effective Entry Point
Breakout trading is effective because it exploits the imbalance between supply and demand. When the price of an asset breaks out above a resistance level, there’s more demand for the asset than there is supply.
This increased demand is likely to drive the price of the asset higher. Getting in early in this process can be advantageous if your estimates are correct.
Similarly, when the price of an asset breaks out below a support level, it signals that there is more supply of the asset than there is demand.
This increased supply can drive the price of the asset lower. And of course, getting in early in the selling spree is more advantageous than entering later in the game.
When prices break out, there’s a disruption in expectations of supply and demand. And if there are concentrations of stop losses on either side, the ensuing price jump can be more volatile than expected (a plus if you’re on the right side of the market).
A Big Caveat to Keep In Mind
As we mentioned earlier, not all breakouts can guarantee a continued trend in the breakout direction. Breakouts can fail, and the nature of the breakout (or the setup, like a particular chart pattern) will differ in performance stats (different failure and success rates).
This is why you should seek additional confirmation signals and be prepared for an alternate plan in case your breakout ends up “false.”
What Are the Pros and Cons of Trading Breakouts?
Breakouts are a common and effective strategy for trade entries. Despite this, however, it would be wise to keep in mind the pros and cons.
Pros of Trading Breakouts:
- Breakouts can be very profitable (or not), as they can signal the start of a new trend (meaning, you’re getting in on the “ground floor” of a price swing).
- Breakout trading is a relatively simple strategy to learn and execute.
- Breakout trading can be used to trade a variety of different assets and markets.
Cons of Trading Breakouts:
- Breakouts can be false breakouts, and this varies according to pattern and market.
- Breakouts can take time to develop, requiring patience (which is hard to do if you’re a day trader).
- Breakout trading can be risky, especially if support and resistance holds.
How to Trade a Breakout #1 – Historical Support and Resistance
To trade breakouts effectively, it helps to have a clear understanding of basic support and resistance concepts.
Here are some tips for trading breakouts effectively:
1 – Identify key support and resistance levels.
2 – Look for breakouts on increasing volume.
3 – Enter positions in the direction of the breakout shortly after the breakout occurs.
4 – Use stop-loss orders to limit your losses.
5 – Take profits at key resistance and support levels.
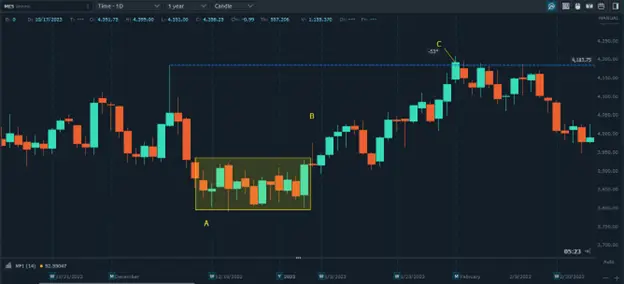
Here’s an example using a daily chart of Micro Gold (MGC) on the Optimus Flow platform

How might you have traded this breakout scenario? Here’s one approach.
A: MGC prices establish a low, rising but then reversing to retest the low.
B: Prices bounce off the previous level, establishing historical support based on the low at A. Once again, prices fail to reach the previous high, reversing once again to rest support.
C: Prices retest support but bounce before reaching the previous levels. Optimism seems to prevail as buyers jump in to lift prices. But once again, prices fail to get above the last swing high point, indicating bearishness.
D: This time, the retest results in a downward breakout. Based on the previous failures to rally, you might have placed a sell (short) stop order below support. Note the volatile drop that occurred once price broke through.
Many sell orders were likely triggered by this move, causing prices to plunge more aggressively downward.
There are many ways you might have taken profit. One way that would have worked was to measure the distance between the last swing high and the support level, projecting that same measured distance below the breakout price.
If you had done that, you would have exited the trade with a positive return before prices reversed to the upside.
How to Trade a Breakout #2 – Pattern Breakout
When trading pattern breakouts, bear in mind that each pattern has a different statistical profile, and some patterns are more reliable than others. There are sources you can use to see the statistics on pattern breakouts and failures.
Here are general tips for trading breakouts effectively:
1 – Identify key support and resistance levels on the chart pattern.
2 – Look for breakouts on increasing volume.
3 – Enter positions in the direction of the breakout shortly after the breakout occurs.
4 – Use stop-loss orders to limit your losses.
5 – Take profits at key resistance and support levels.
Here’s an example using the Micro Emini S&P 500 futures on the Optimus Flow platform.
Note the rectangle pattern (see shaded yellow rectangle). Here are a few ideas as to how you might have traded this breakout.
A: The rectangle pattern, a period of tight congestion, is quite pronounced.
B: You might have placed a buy stop a few ticks above the breakout, while placing a stop loss below the pattern.
C: Typically, you’d measure the height of the pattern and add it to the breakout level to determine your profit target. But in this case, we opted for closing the position right at the 52-week high (see blue dashed line).
This was a clear cut breakout scenario. Again, not all patterns will work out this ideally.
How to Trade a Breakout #3 – Price Channels
Price channels can be tricky and they often depend on the prevailing trend. Price channels outline the upper and lower regions of a price trend.
So, if price is trending strongly upward, then a breakout to the downside may not necessarily mean a total reversal but rather a minor correction. Use caution when trading price channel breakouts, as you will want to remain on the right side of the trend.
Here are some tips for trading breakouts effectively:
1 – Identify the prevailing trend and note the channel’s support and resistance levels.
2 – Look for breakouts on increasing volume (preferably in the direction of the prevailing trend).
3 – Enter positions in the direction of the breakout shortly after the breakout occurs.
4 – Use stop-loss orders to limit your losses, placing them below the channel or at the most recent swing low or high.
5 – Profit taking will vary depending on your strategy.
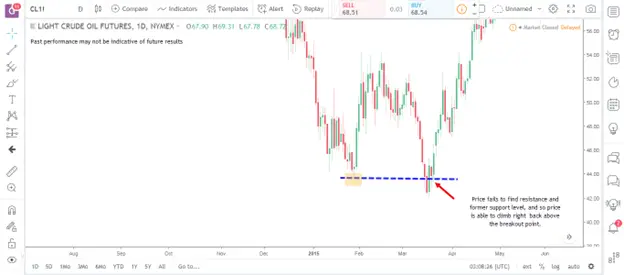
Here’s an example of crude oil (CL) futures on the Optimus Flow platform.

Remember what we said about trends? Note how the price has been trending upward before our channel at A.
A: The price channel is a clear correction in the middle of an uptrend. To be on the right side of the trend, you wouldn’t go short here but rather wait for prices to break out again in the direction of the uptrend.
B: Price breaks out and you will want to have entered a long position at this point, placing a stop loss at the most recent swing low (below the lowest part of the channel).
C: We decided to close the position at the 52-week high (see dashed blue line). With channels, determining your profit target is situational as it will depend on many factors concerning the particular price and trend action surrounding your trade.
It’s not like chart patterns that have a more standard yet flexible metric for determining when to exit a trade.
Can I Avoid False Breakouts?
It can be extremely difficult to predict when a false breakout may take place. And this is why you should have a contingency plan for false breakouts and manage your positions when they do happen.
There are some techniques for anticipating false breakouts or “fakeouts.” Let’s discuss that next.
Why Do False Breakouts Happen?
The phenomenon of false breakouts stands as a pivotal concept that you’ll eventually have to navigate. At its core, a false breakout can mislead you into believing a price will continue in a breakout direction, only to reverse course, often resulting in losses.
False breakouts occur when one side of the market overpowers the other at a critical price level. Often, the dynamic interplay between retail and institutional traders also plays a crucial role in the emergence of false breakouts.
Institutional traders, with their substantial resources, frequently initiate large volume trades that retail traders attempt to follow, not realizing the move could be a strategic play leading to a false breakout.
So, is there a way to identify the likelihood of a false breakout so as to anticipate them?
Breakouts vs Fakeouts: How to Tell the Difference
Most traders have experienced that moment in their trading career where an exciting breakout situation horribly turned against, getting hit by a “fakeout” that was cleverly disguised as a breakout scenario.
Although there are no surefire signs that a breakout will fail, there are a few characteristics that may indicate the possibility of such an event:
1 – Watch for Sharp Price Movements
Breakout traders believe their most successful trades typically follow periods of sideways market activity, such as after a market emerges from a wedge pattern, a head and shoulders pattern, or a phase of sideways consolidation.
However, newer traders often become overly enthusiastic about potential breakout opportunities whenever the price nears a key level.

Frequently, when the price moves rapidly towards a significant resistance or support area, it might actually be preparing for a reversal rather than a breakout. While this isn’t an absolute rule, it’s a common occurrence in market behavior.
Let’s now look at a conventional breakout setup to differentiate between the two scenarios.

In a standard breakout scenario, the approach to an important swing point is marked by typical price movements, including regular pullbacks that indicate a balanced engagement between buyers and sellers.
These pullbacks establish minor support and resistance levels, which can serve as benchmarks to prevent a fakeout.
For example, if the second pullback occurs just above the breakout point (indicated by a blue dotted line), it acts as a short-term resistance level, making it more likely for the market to continue moving downward rather than reversing upwards as part of a fakeout.
2 – Watch for the Delayed Pullback
Breakout traders often look for a price pullback to the breakout point after the initial move as a confirmation of a genuine breakout, which also helps protect against potential fakeouts.
A key indicator of a fakeout is when a support level does not become resistance or a resistance level does not become support, indicating the initial breakout signal may not be reliable.
This passage describes an instance where the market attempts but fails to break below a significant swing low. After this failed attempt, the market revisits the breakout point, a critical moment for experienced traders to watch closely.
In a typical breakout scenario, if the price had remained below the breakout point acting as resistance, it would indicate sellers driving the price lower. However, when the price easily moves back above the breakout point and uses it as support, it leads to an increase in price—a classic fakeout situation.

In this example, the price initially crosses below the blue dotted line (swing low) and then briefly returns to test this level, potentially as resistance.
This is confirmed by a series of bearish candlesticks and a noticeable disinterest from traders in pushing the price above the breakout point. This scenario, with the delayed pullback serving as additional confirmation, constitutes a solid breakout play.
3 – Watch for Traffic Past Breakout Points
A common mistake traders make is focusing too narrowly on the immediate breakout point, neglecting the broader market context and other factors that could influence a breakout or fakeout.
This broader perspective includes examining nearby support and resistance levels, trend lines, and technical analysis tools like pivot points or Fibonacci levels.
It also encompasses analyzing multiple time frames to identify short-term or long-term trends, candlestick patterns, and the general market momentum. The example below hints at an example showing how a promising breakout play may fail due to nearby obstacles.

In a typical breakout scenario, the market moves from a period of sideways consolidation to a downside breakout, retesting to confirm the shift of former support to new resistance.
However, this movement halts at a significant level that previously acted as both support and resistance, potentially catching an informed trader less off-guard due to awareness of nearby market developments.
We just presented a few techniques to help you anticipate genuine breakouts from fakeouts. Although no method guarantees perfect detection, combining these strategies with experience and practice can significantly enhance your ability to anticipate these market movements effectively.
Seven Additional Tips for Identifying and Trading Breakouts
Pulling off a breakout trade successfully hinges on your ability to identify and manage a position post-breakout, whether it continues in the direction of the breakout or reverses. Here are seven additional tips to help you refine your approach to capturing stronger post-breakout moves.
1. Pullback and Retest: A critical strategy for validating breakouts. Genuine breakouts often see the price returning to test the initial breakout level, providing a safer entry point.
2. Trend Direction: Always consider the overall trend before trading a breakout. Aligning your trades with the direction of the major trend increases the likelihood of success.
3. Bollinger Band Trends: Bollinger Bands can help identify strong trends and potential breakout success rates. Breakouts occurring near the band’s edges are more likely to continue in the trend’s direction.
4. Volume Analysis: Volume spikes during a breakout indicate strong market participation and a higher chance of the breakout sustaining its direction.
5. Triangle Patterns: Triangles signify consolidation and potential breakout points. The pattern’s culmination often leads to significant price movements.
6. The Spring Pattern: Coined by famed technical analyst Richard Wyckoff, this pattern describes a false breakout preceding a genuine one, highlighting the importance of patience and observation.
7. Momentum Indicators: Utilizing indicators like the RSI, MFI, ADX, or the Stochastic Oscillator can help you gauge the strength driving a breakout, This, in turn, can help you decide whether to take a position, when to take a position, and how large a position to take.
The Bottom Line
Breakout trading can be a powerful strategy to add to your trading toolbox. Breakout trading leverages the volatility and momentum generated when prices move beyond established support or resistance levels.
Hopefully, this guide made it easier for you to tell the difference between real and fake breakouts while providing a few strategies for anticipating and trading post-breakout movement.
Even though some breakouts present more high-probability trades, always be careful with every attempt, and have a plan for when a breakout fails (it does happen).
With more practice, you’ll be able to increase your odds of success when trading this particular method. Becoming a successful futures trader takes time. So be patient, manage your risks, and don’t get discouraged. Happy trading!
Trading Futures and Options involves substantial risk of loss and is not suitable for all investors. Past performance is not necessarily indicative of future results.