The article on Average True Range Indicator is the opinion of Optimus Futures, LLC.
- The Average True Range is a flexible tool whose use goes far beyond the measuring of market volatility.
- You can modify it to track the changing dynamics of a given trading environment for setting profit targets and stop loss levels.
- While ATR does not provide effective directional signals, it’s a valuable confirming indicator alongside other indicators and strategies.
The Average True Range (ATR) is a volatility indicator first introduced by J. Welles Wilder in his 1978 book “New Concepts in Technical Trading Systems.” The ATR is essentially a 14-period average of the True Range, which is determined through the following calculations:
The True Range is the largest value among:
- The difference between the current high and the current low.
- The absolute value of the difference between the current high and the previous close.
- The absolute value of the difference between the current low and the previous close.
While ATR does not directly provide buy or sell signals, it is valuable for setting reasonable profit targets and stop-loss levels that align with current market conditions. Additionally, ATR can be used as a supplementary indicator, corroborating signals from other trading systems like candlestick patterns or Bollinger Bands® analysis.
This is what to focus on in this article: using ATR to set profit targets, stop-losses, and as a confirmation tool.
What Makes the Average True Range (ATR) Effective?
The Average True Range (ATR) is essentially a tool that measures how much a market is moving. It doesn’t tell you the direction of the market, but rather how dramatic the price changes are.
Think of it as a way to understand how ‘lively’ or ‘quiet’ the market is:
- High ATR values mean there’s a lot of action with prices moving up and down significantly, kind of like a roller coaster.
- Low ATR values suggest that things are more calm, like a gently flowing stream.
This is really handy for traders because it helps you get a sense of the market’s mood. With this knowledge, you can plan your trades accordingly. It’s like measuring the pulse of the market’s energy, which is pretty helpful when making trading decisions.
Let’s look at a simple example.
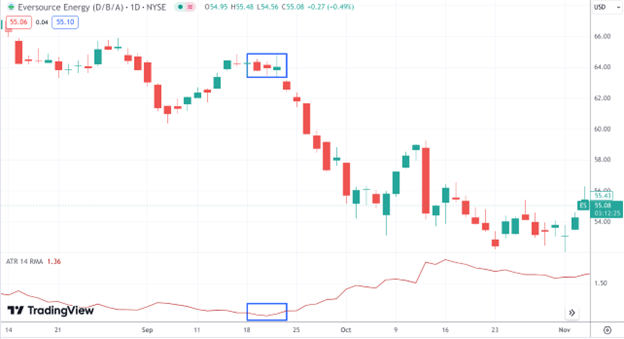
CHART 1. DAILY CHART OF S&P 500 FUTURES (ES). Note the two blue boxes and how they highlight the correlation between the prices and the low ATR range.
In the example above, the ATR declined to extreme lows, indicating that an explosive move may soon follow. Sure enough, a significant move to the downside followed, with the ATR rising to statistically high levels.
A trader might have taken advantage of this lull in market action, indicated by the ATR, anticipating a breakout on either side (up or down) and trading the swing to its full extent.
Using Average True Range (ATR) to Set Stop Losses
Using the Average True Range (ATR) to set stop-loss levels in trading involves a few key steps. Here’s a simple guide:
Find the ATR Value: First up, hop onto your Optimus Flow platform. You’ll spot the ATR value there. It’s typically set for a 14-period, but hey, feel free to tweak it to suit your trading style. Just remember, the shorter the period, the wilder the swings in ATR value.
Selecting an ATR Multiple: Choose a multiple of the ATR value (like 1x, 2x, 3x) based on your risk tolerance and the characteristics of the market you’re trading in. For more volatile markets, you might use a higher multiple.
Setting the Stop-Loss Level:
- For a long position: Subtract the ATR multiple from your entry price. For instance, if your entry price is $100 and the ATR is $5, a 2x ATR stop-loss would be set at $90 ($100 – $5*2).
- For a short position: Add the ATR multiple to your entry price. Using the same numbers, a 2x ATR stop-loss would be at $110 ($100 + $5*2).
Adjusting Stop-Loss for Trading Strategy: Your stop-loss setting also depends on your specific trading strategy and entry point. For instance, if you enter a trade based on a breakout, you might set the stop-loss at 1x ATR from the high or low of the breakout candlestick.
Consider Position Sizing: Your position size will also influence where you set your stop-loss. It’s essential to ensure that the stop-loss level aligns with your overall risk management strategy and account size.
Using ATR for Trailing Stops: ATR can also be used for setting a trailing stop-loss. As the market moves in your favor, you can adjust the stop-loss level according to the ATR to lock in profits while still giving the trade room to move.
Example:
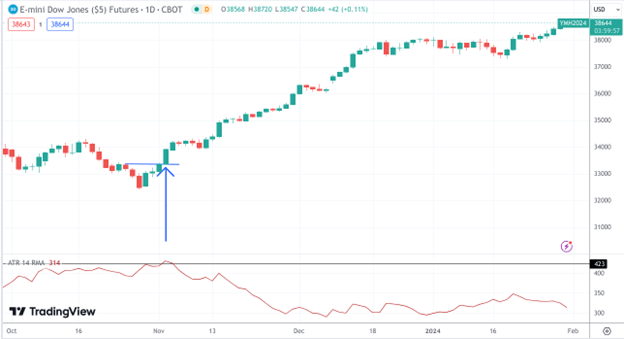
CHART 2. DAILY CHART OF YM. Blue line indicates the market entry upon breakout.
In this Dow Jones futures trade, you might have gone long at the break out of 34000. Looking at the ATR, the average daily volatility is on the high side, 423 points. Aware that volatility has spiked, it indicates the possibility that volatility might subside.
So, you place a stop loss 423 points below your entry at 33577. And with the confidence that volatility is likely to decrease, you’re able to ride the trend all the way up, trailing your stop according to the declining ATR rate (from 423 down to 300 points).
Profit Targets and Average True Range
Similar to stop losses, you can also project your profit targets using the ATR. Here are a few simple steps to follow:
1 – Identify the Daily ATR Value: Determine the ATR value for the day. This step is crucial as it tells you the average range your asset is likely to move in a single trading session. For instance, if the YM has a daily ATR of 300 points, it indicates an average movement of about 300 points per day.
2 – Combine ATR with Market Structure: When setting your profit target, don’t rely solely on the ATR value. Incorporate market structure analysis, considering support and resistance levels, along with swing highs and lows. This approach helps you to identify realistic levels where the price might reach within the trading day or over your intended holding period.
3 – Setting Your Profit Target for YM: Based on the ATR and market structure, select a suitable profit target. If you’re looking at multiple potential resistance levels for a long position, choose one that is within the daily movement range suggested by the ATR but doesn’t far exceed it.
Suppose there are resistance levels at 100 points, 250 points, and 400 points away from your entry, and the daily ATR is 300 points. The 250 points resistance level could be a reasonable target, as it’s achievable within the ATR’s indication and provides a significant profit opportunity without being overly ambitious.
4 – Adjusting for Time Frame: For trades intended to last beyond a day, consider the weekly or monthly ATR values for YM to set your profit targets. This adjustment is vital for aligning your targets with the expected market movement over your trade’s duration.
Example:
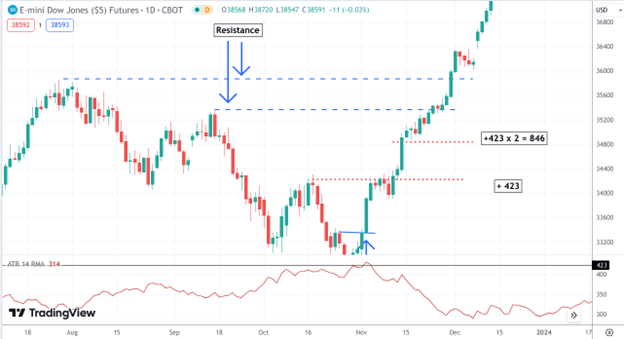
CHART 3. DAILY CHART OF YM. Note the blue resistance levels (market structure) and the two red dotted lines, both ATR-derived profit targets.
The example above is the same as the previous example, but this time focusing on using ATR as a means to get a profit target.
The first profit target is based on the price (34000) plus ATR (423). The second target is based on the price plus ATR*2 (846 points). Note how both targets are below the resistance levels (market structure). Perhaps these targets might have been more realistic at the time, but eventually, the YM exceeded all of those levels. You would have ended the trade with a profit but you might not have been able to catch the full trend.
Average True Range as a Confirming Indicator
ATR alone might not be the best indicator to determine entry and exit signals (you always have to check market structure) as it wasn’t designed specifically for such purposes. Even more so, ATR isn’t capable of telling you the direction of the trend.
But ATR can make an effective confirming indicator to those that are designed to generate signals and monitor trends.
Integrating ATR with other indicators can create a comprehensive and powerful approach to market analysis. Here are a few examples.
Price Action Strategies: ATR can be effectively used alongside price action strategies. Price action focuses on the movements of prices themselves rather than relying on external indicators.
- Rising ATR + Uptrend: For instance, if an asset in a strong uptrend shows an increasing ATR, it could indicate rising volatility and possibly signal the end of the uptrend.
- Rising ATR + Downtrend: Conversely, a decreasing ATR in a downtrend might suggest the market is stabilizing, potentially leading to a market rebound.
Relative Strength Index (RSI) and Stochastic Oscillator: Both the RSI and Stochastic Oscillator are momentum indicators that can be complemented by the ATR. The ATR can help filter or confirm signals provided by these indicators.
- For example, an oversold signal by the RSI coupled with a low ATR might suggest the market is not as oversold as it appears, providing a more nuanced view of market conditions.
Support and Resistance Levels: Using ATR to help analyze support and resistance levels can help you decide on the timing of their trades. If a stock is nearing a critical support level, waiting for the ATR to rise before making a trade could provide additional confirmation of a potential breakout or reversal, indicating increased market volatility and interest around these price levels.
- We saw this in the first chart (see Chart 1). ATR was contracting while prices were approaching a resistance level, leading to a strong downside breakout.
Stochastic Indicators: These can be used with the ATR to counteract the stochastic tools’ tendency to produce false signals in markets that do not fluctuate between two distinct price points. Meanwhile, the ability of stochastics to indicate overbought or oversold conditions can help interpret ATR movements.
Parabolic SAR: Created by the same inventor, the Parabolic SAR can work well with ATR by showing market direction along with ATR’s volatility indications, providing clarity on market movements.
Moving Average Convergence/Divergence (MACD): Often used for identifying entry points and momentum shifts, MACD can be paired with ATR for exit strategies, complementing each other in identifying potential reversals or continuations in price.
When combining ATR with these indicators, remember that ATR is a lagging indicator, primarily reflecting past volatility. Don’t use it in isolation for predictive purposes. Instead, look at it as a tool for confirming other signals or managing risk based on market volatility.Using it in this way, the ATR can help you identify more reliable trading opportunities and manage trades more effectively.
Please be advised that trading futures and options involves a substantial risk of loss and is not suitable for all investors. Past performance is not necessarily indicative of future results. The matter is intended as a solicitation to trade.