This article on Support And Resistance Order Flow is the opinion of Optimus Futures.
All technical traders are familiar with horizontal support and resistance levels in the market formed by prior occasions of price bouncing off of certain price levels. They are a foundational construct of technical analysis, and rather simple to spot and apply on charts. The simplicity that comes with dragging across a horizontal line on a chart is also what makes these levels so popular and widely followed by traders.
In this article, we will discuss how support and resistance levels can help you better filter trade setups when you combine them with order flow dynamics.
First – Let’s Talk Liquidity
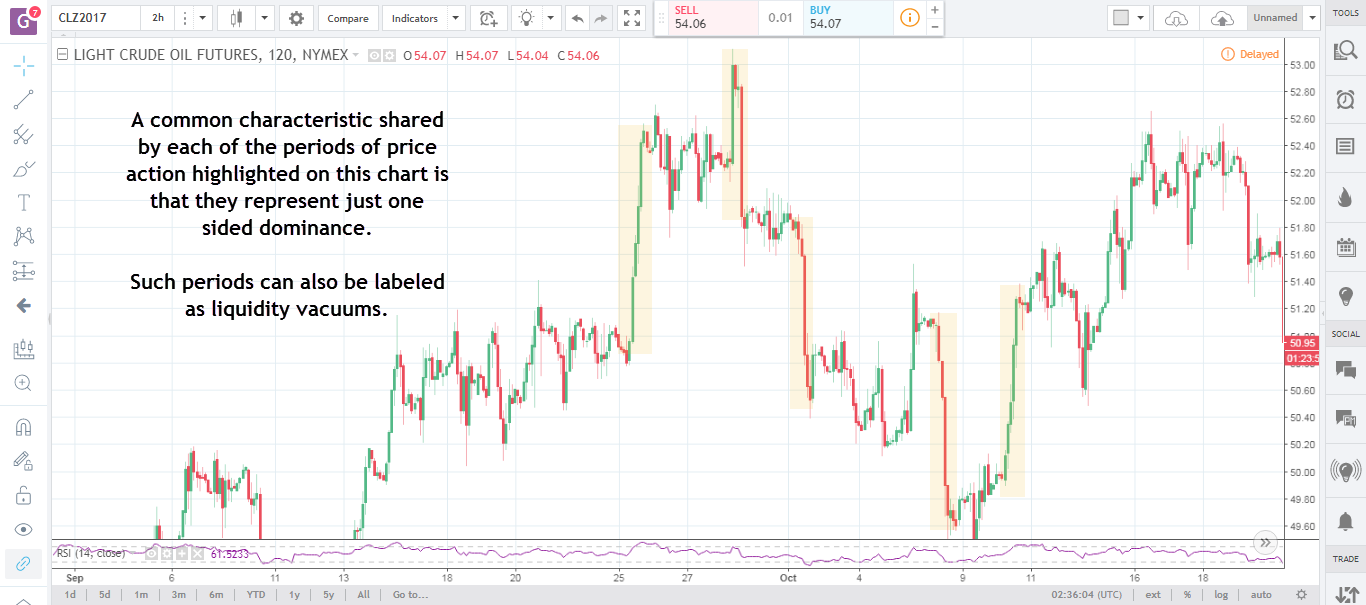
Ideally, a nice mix of buyers and sellers are needed to make a market liquid, which prints on the chart as normally sized candlesticks either moving in a pattern or sideways. But occasionally the market will spring out of balance that some traders label as “liquidity flux” or “liquidity vacuum.” On your chart, this is simply a brief period of a very sharp move in one direction:
Let’s further break this down into even simpler pieces…
If there is a buyer for every seller in the market at the same price constantly, the price will have no reason to move at all. This hypothetical case would have printed on your chart as a straight horizontal price line. If buyers exceed sellers, we would see the price being pushed higher, and if sellers exceeded buyers, we would see the price being pushed lower.
The liquidity vacuum is a more extreme instance of the same phenomena. Buyers will sometimes dominate the sellers so convincingly that price literally ‘flows’ through, as if in a vacuum, up until we hit price levels where both the parties are more comparatively balanced.
The key takeaway is to be aware of price when it is accelerating into a key support and resistance level, aka liquidity vacuums. Before we proceed, please take a look at the chart above highlighting periods of liquidity vacuums. Notice how almost none of the apparently “dominant” moves failed to mature into reasonable trends!
There is often a very logical reason for these liquidity vacuums to exist in the market. So for example, when the price is sitting under resistance, and sellers are eyeing that resistance level to unload their sell orders, there is very little reason for them to be selling under that key resistance level anyway. Therefore, in this case, buyers will likely face little friction as they bid prices higher into resistance.
On your chart this prints as a strong move up into the level often imitating a breakout to the upside if you were to consider “momentum” only. However, as discussed, buying into resistance can potentially turn out to be a trap as sellers jump in to take over causing a sharp bounce off the key level.
Many technical traders will look at support and resistance levels in the market as just areas where price may possibly hold up or bounce off. Few traders comprehend their existence as “order flow magnets”.
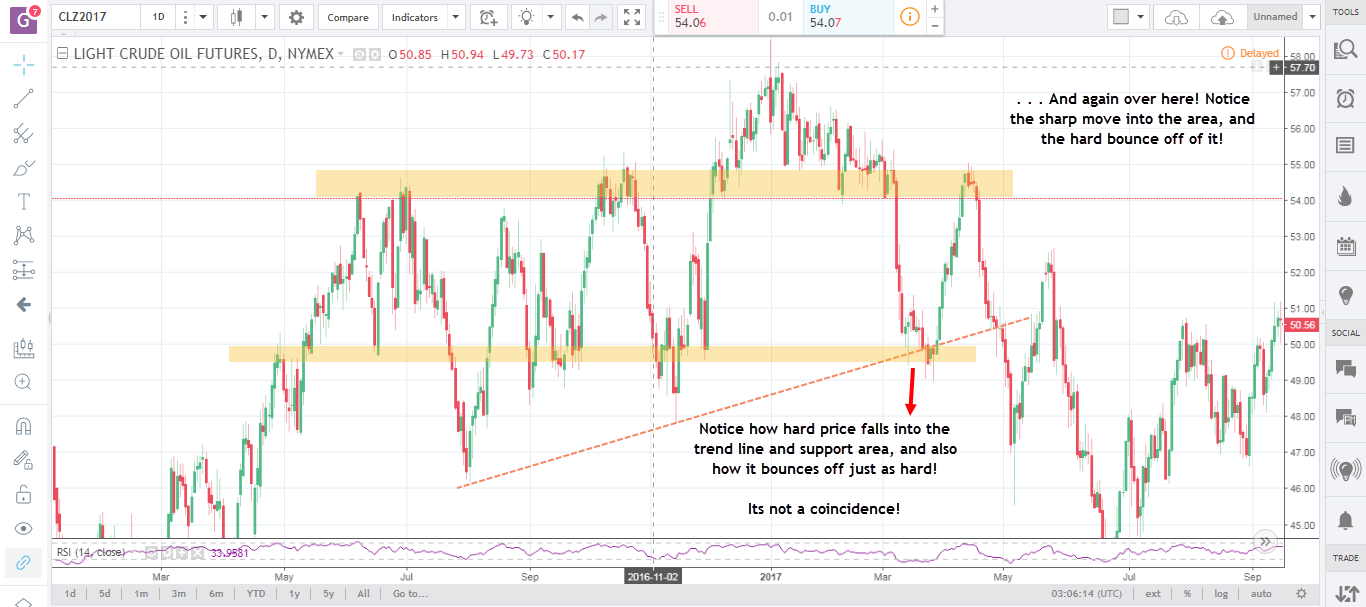
We pointed two instances on the chart above where price is rapidly moving into an area only to create a bounce off the level just as hard! This is a very common occurrence. Can you decode the price action here?
Buy orders that mattered were just stacked up at the support level, allowing for sellers to easily push price lower toward the support level (hence the term “order flow magnet”). Conversely, a large block of sell orders were waiting around the highs near the resistance level drawn, this time allowing buyers to dominate the market until the price hit that critical resistance level.
Novice traders might mistakenly interpret this increased selling above critical support as a sign of momentum and possibly get excited about a push through. The same would apply to the other case highlighted as well.
Typically, when eyeing for a breakout of a level, you would expect the price to cautiously approach the level, test the regions beyond it and maybe even pullback to the level to see if it flips from support to resistance or vice versa. Sharp moves leading into key levels need to be watched very carefully. Such rapid movements may not be a sign of momentum at all, and may reflect underlying order flow dynamics indicating possibly the exact opposite!
If you look at support and resistance levels as just potential areas of interest for the price but fail to see how that interest is actually printed on your charts, you are only trading them with partial effectiveness. Support and resistance levels (and trend lines for that matter) can make your strategy much more solid when you combine them with order flow dynamics.
Very often, how price behaves just as it approaches a key level in the market will speak volumes about what you should expect the price to do as it hits that actual level. This know-how is effective when it comes to filtering trade setups as well as managing running trades or analyzing the markets in general.
Click Here to Learn More about Trading Futures with Support and Resistance Levels.
There is a substantial risk of loss in futures trading. Past performance is not indicative of future results.


