Elliott Wave Theory builds on the classic Dow Theory that describes price movements and explains repetitive price patterns in the financial markets. As the name suggests, Elliott Wave Theory focuses on wave patterns in the markets and it uses wave counts and other components of technical analysis around momentum moves to describe trends.
Elliott Wave 101
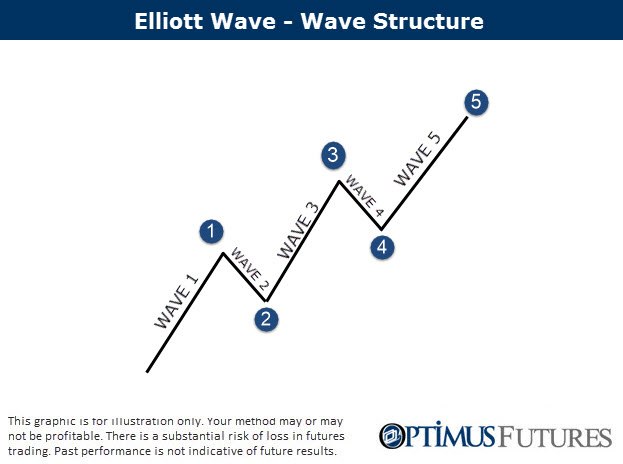
Before we can get into the more advanced components, it is important to understand how Elliott looks at trends. Elliott Wave Theory states that each trending phase consists of 5 waves on average; 3 of which go in the direction of the trend (impulsive waves) and 2 go against the trend (corrective waves).
Based on Elliott Wave Theory, a trend is more likely to end or even reverse after the 5-wave-count has been completed. And this is where many people go wrong; after you see the fifth wave, it does not automatically mean that price is going to turn – it just highlights a higher likelihood and we will explore in more detail how to improve the understanding of price charts later.
In the picture below, waves 1, 3 and 5 are the waves that go in the direction of the bullish trend – they are called impulsive waves. Waves 2 and 4 go against the trend and are correction waves.
Advanced Elliott Wave rules
As we said earlier, Elliott Wave Theory is based on classic Dow Theory and when we take a closer look at the nitty gritty of Elliott Theory, this will become clearer.
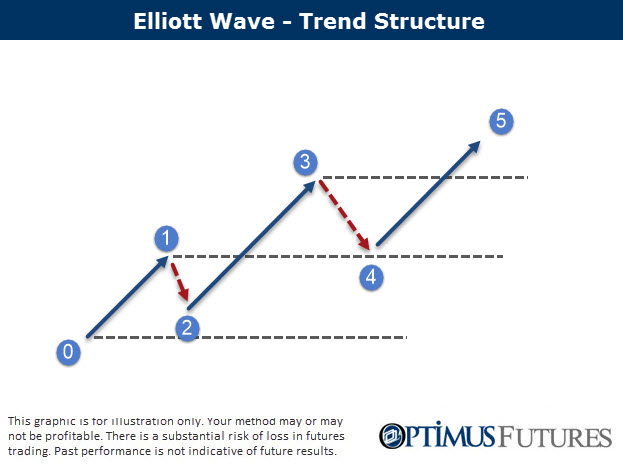
Remember, Dow Theory states that an uptrend is present when price makes higher highs and higher lows and vice versa for bearish trends. Now let’s come to 3 important Elliott Wave rules:
#1 – Wave 2 (the first corrective wave) cannot retrace below the origin of wave 1. This would mean that price made a lower low during an uptrend and violate the Dow Theory.
Point 2 cannot reach below point 0
#2 – The second corrective wave cannot be lower than the first high.
Point 4 cannot be lower than point 1
#3 – The second impulsive wave is usually longer than the final impulsive wave.
Trend 2-3 is usually longer than the wave from 4-5
Trend end and reversion with Elliott wave
Elliott wave theory is very popular because of its simplicity and the clear cut rules. However, when it comes to practical application, being too fixed on such rules can lead to problems. When traders expect to see a trend ending after 5 waves each time, they might exit their potentially profitable trades too soon or enter a reversal trade too early.
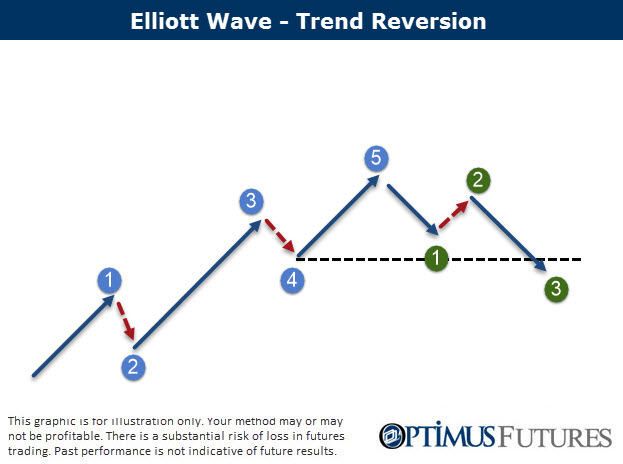
In fact, Elliott does not state that a trend ALWAYS has 5 trend waves but more information is needed to make sophisticated trade decisions. For that, we will come back to the Dow Theory and the screenshot below.
After the 5 wave count is completed, a trader needs to wait to see if price can break the Dow Theory trend structure. Once price fails to make a higher high, and starts making lower lows, this is the information that the trend might be over.
In the image below you can see that after the bullish trend cycle has been completed, price failed to make a higher high and then even broke the lows and started to make lower lows.
Elliott Wave Theory is a good starting point and foundation for your technical analysis but a trader always needs to stay flexible and open-minded when analyzing charts. It is also important to combine Elliott Wave Theory with conventional Dow Theory and analyze how highs and lows form on your charts; just because you see a completed 5 wave pattern, it does not automatically mean that the trend is over.
There is a substantial risk of loss in futures trading. Past performance is not indicative of future results.