When analyzing charts, most traders tend to focus on price action and then apply standard principles of technical analysis to come up with trade ideas and find potential entries. These traders often miss important information because price does not always tell the whole story. By looking at volatility and volume-based indicators, traders can often find out more about the driving force behind such price movements.
In what follows we take a look at two volatility and volume based trading indicators and explore how to use them to analyze price in a potentially more efficient way.
Market Facilitation Index (MFI)
The market facilitation index (MFI) is an indicator that analyzes and visualizes momentum and price strength. The MFI is a confirmation indicator that analyzes buying and selling pressure by looking at price movements and whether volume is falling or rising.
Therefore, the MFI is used by trend-following traders who want to know if a trend is strong enough to enter and by counter-trend traders who look to fade trends.
Indicator components
The MFI usually comes in the form of a histogram below price or directly as signals on your price charts. In this article, we used Tradingview.com’s MFI indicator where the 4 MFI signals are plotted directly below price.
The MFI always comes with 4 signals:
- Confirmation (green)
This information is mainly used by trend-following traders to stay in trades. When you see a green dot it means that volume is rising as price moves in the direction of the trend. This information tells you that the trend is healthy and price movements are driven by a rising amount of traders.
- Fade (blue)
A blue dot means that there is indecision in the market and that price moves are relatively small and volume is also decreasing. Here it is important to understand that a trend can still go on for quite some time, but the buyer-seller dynamic is changing and not as many traders are entering new positions.
- Fake (grey)
The fake signal shows that price and volume are going into opposite directions and that a reversal becomes more likely.
- Squat (red)
The squat signal shows a strong “fight” between bulls and bears and a squat signal usually means that the volume was above average and relatively high. A trend reversal is less likely during and after a squat signal and you can often see explosive moves during a squat candle.
Analyzing MFI information
On the left you can see that during the bullish trend, the red squat signals caused the largest moves as those were high volume candles. The grey fake bars were mainly consolidation candles with smaller price moves. At the top you can see that the red high volume squat bar was followed by a blue fade candle that then foreshadowed the reversal – the previous blue fade candle during the trend was very small in size and meaningless.
The Acceleration / Deceleration (AC) Indicator
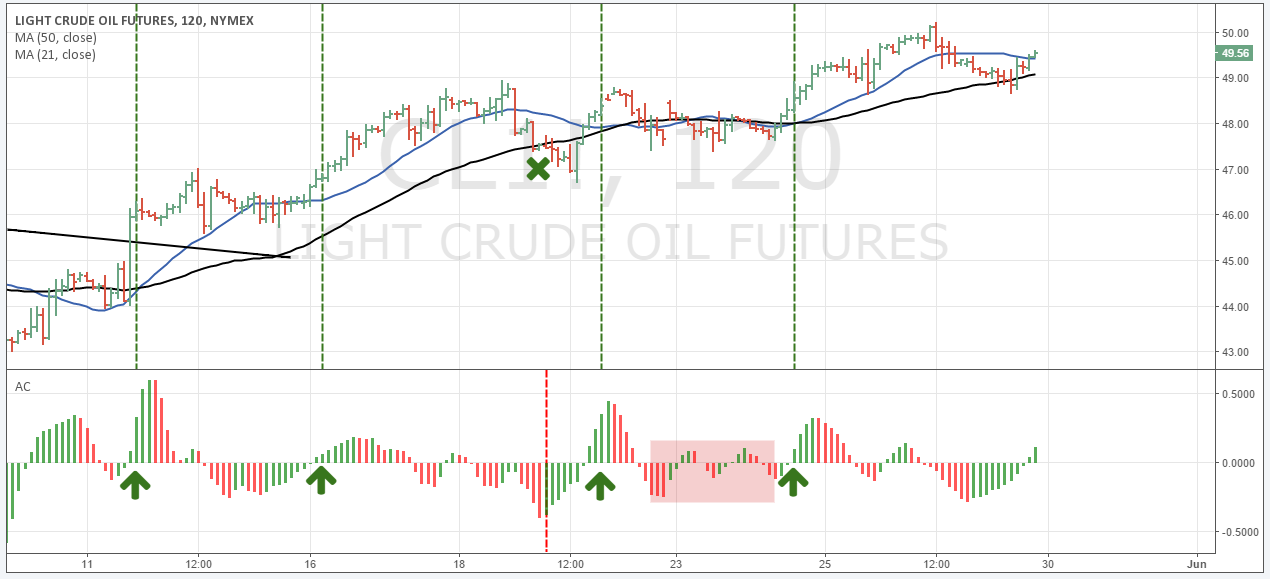
The Acceleration/Deceleration (AC) measures how many buyers and sellers there are and who the driving force behind price movements is. Therefore, the AC oscillator is also used for trend-following or reversal trading purposes.
Basically, when the AC bar is green, it shows that price is rising and there are more buyers than sellers. When the AC bar crosses above zero, it often provides a buy signal (but we explore this in more depth later) – the higher the green bar, the stronger the price move and the more buyers there are.
The AC works the same way into the opposite direction with red bars. The potentially more accurate signals can be found during trending markets – the AC does not work as well during ranges.
(Buy signal, sell Signals, or the discussion of signals does not guarantee profits. It simply says there is a confirmation to take a potential trade. There is substantial risk of loss in futures trading. Past performance is not indicative of future results)
Signal 1: the 0-line shift
One of the signals of the AC occurs when the bars cross from one side to the other. In such a scenario, the market goes from having more sellers to seeing more buyers. This can often foreshadow the creation of new trends.
Typically, traders wait until they see at least 2 new bars above or below the 0-line before making trading decisions to avoid premature entries.
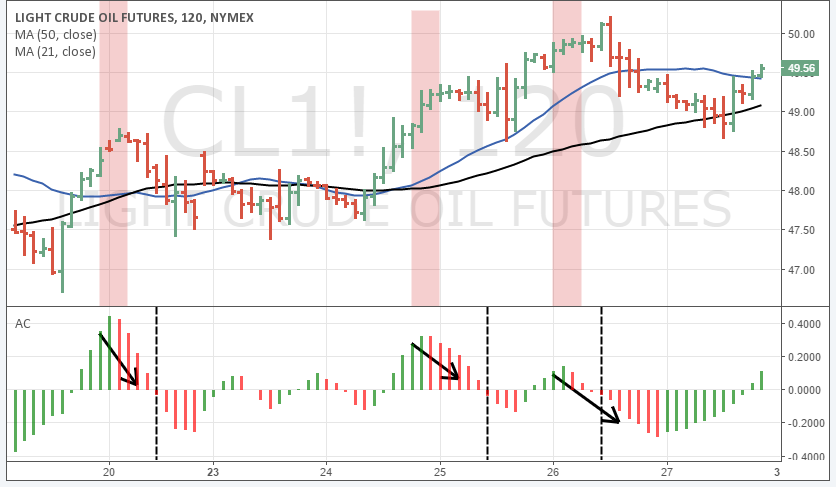
Signal 2: the color change
The second signal of the AC is given when the bars change from red to green (or vice versa) during a trend. When you see that the indicator changes from green to red during an uptrend, it means that more sellers are coming into the market and that a reversal is more likely.
The 2-bar rule also applies here and traders usually wait for at least 2 consecutive bars in the same color.
Essentially, the MFI and the AC indicator provide very similar signals and there is no better or worse when it comes to deciding between the two indicators. We suggest that you try both to see which one feels more natural to you and then see how the volume and volatility based indicators can add value to your price analysis.
Keep in mind, the volume and volatility based indicators are not meant to be standalone entry signals but they are used as additional confirmation tools to your regular trading system.
There is a substantial risk of loss in futures trading. Past performance is not indicative of future results.


