Trading divergences are a multi-faceted trading concept that can be applied across different markets, timeframes and indicators. Divergences can help traders understand markets better by finding early warning signals that a trend is losing momentum and can potentially reverse.
Trading Divergence 101
Before we get into analyzing charts with divergences, we have to take a look at what divergences actually are.
Identifying divergences is straight forward: you have a bullish divergence when price makes higher highs but the indicator you are using is making lower highs. A bearish divergence, on the other hand, is the exact opposite: when price makes lower lows and the indicator shows higher lows, traders speak of a bearish divergence.
Divergence are exclusively used during trending markets and not during range markets. At the same time, the indicators used are usually momentum based indicators. We will come back to that later in more depth.

What Divergence Means
When we go through a chart example, it will become clear what a divergence really tells you about a price.
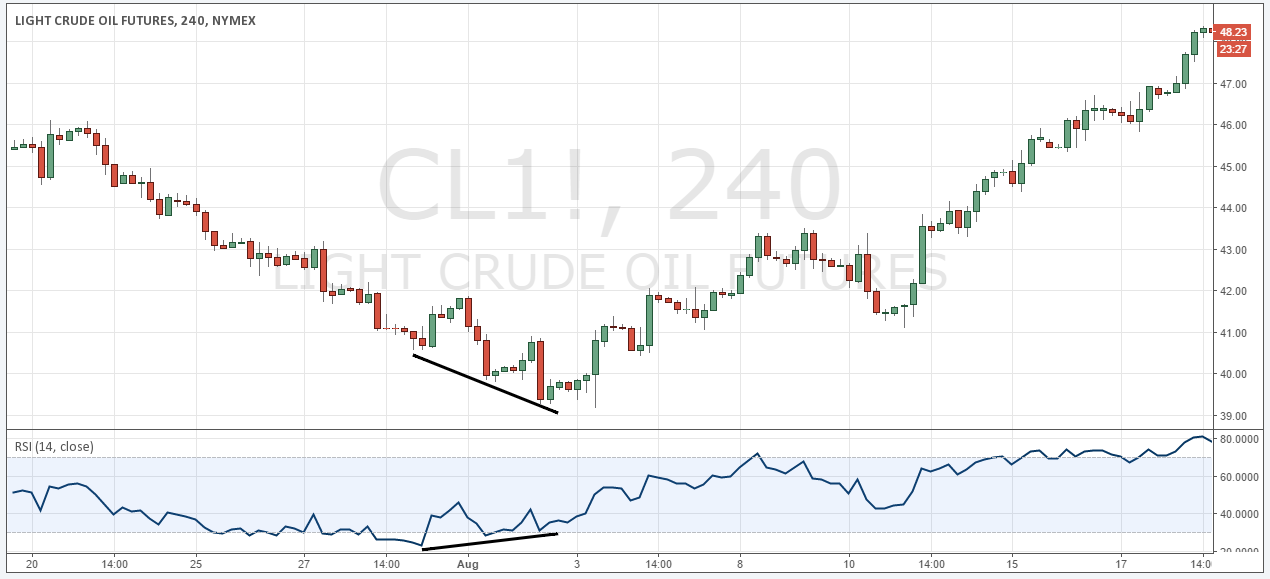
As previously mentioned, you should use a momentum based indicator to identify divergences. RS. There is no better or worse when it comes to indicator selection and you should pick the one you are most comfortable with.
Classic price analysis and Dow Theory states that a trend is valid as long as price keeps making higher highs (during a rally) or lower lows (during a selloff).
Although this is true to some degree, it’s missing a few critical points. Not every trend wave is the same and even though price might make a higher high, it does not necessarily mean that you are still in a valid uptrend. Momentum indicators analyze the strength and the size of trend waves and the price candles within such a trendwave. Thus, when you see that the indicator is falling off and does not make a higher high, it shows that price action is losing its bullish momentum.
Although you can often see when a new trendwave looks weaker than the previous one – less candles and/or smaller candles – using an indicator to identify divergences adds a new level of objectivity to your trading and it also makes the information processing faster.
Confluence with other Trading Concepts
Although divergences are already a powerful concept, it’s advisable to combine divergence signals with other tools, indicators or concepts.
If you want to stick purely to price analysis, you can look for a broken “trend structure”, which means that after a rally and a divergence, you wait until price is also making a lower low and therefore showing additional signs of fading momentum and turning momentum.
Divergences can also be combined with moving averages very effectively. After a bullish divergence, the trader waits until it breaks his moving average and so also confirms the change in trend structure.
Divergences can also be combined with other indicators, although it’s not advisable to combine two momentum-based indicators together. Using two indicators from the same class can create redundant signals leading traders to overestimate the importance of the signal.

7 Key Divergence Trading takeaways
To avoid the most commonly made mistakes when it comes to divergence trading, read the list below carefully.
- Only look for divergences during trending markets – momentum indicators don’t work well during range bound markets
- Use momentum based indicators. The period setting is often not as important and the default usually provides good information
- Don’t look for divergences where the individual highs or lows are very far apart from each other. For example, when you are using the RSI with a 14 period setting, the divergence signal loses its validity if the swings are more than 14 candles away from each other because the indicator slowly resets itself.
- Divergences work best after a long trend and it should be avoided to look for divergences after a very short trend.
- Don’t use more than one momentum indicator to find divergences
- Always look for confluence by consulting other tools or concepts
- Hidden divergences are not a powerful trading signal and should mostly be avoided
There is a substantial risk of loss in futures trading. Past performance is not indicative of future results.