In this article, we will explain supply and demand zones and what they can tell you about price charts as well as how to use them in your trading. First things first: a supply area on a chart is an area where selling interest outnumbers buying interest and the price falls until the buying-selling balance is restored. Similarly, a demand zone is a price level where price rallies because there is much more buying interest than selling interest. All this will become clearer once we start looking at charts.
Supply and demand = the origin of price moves
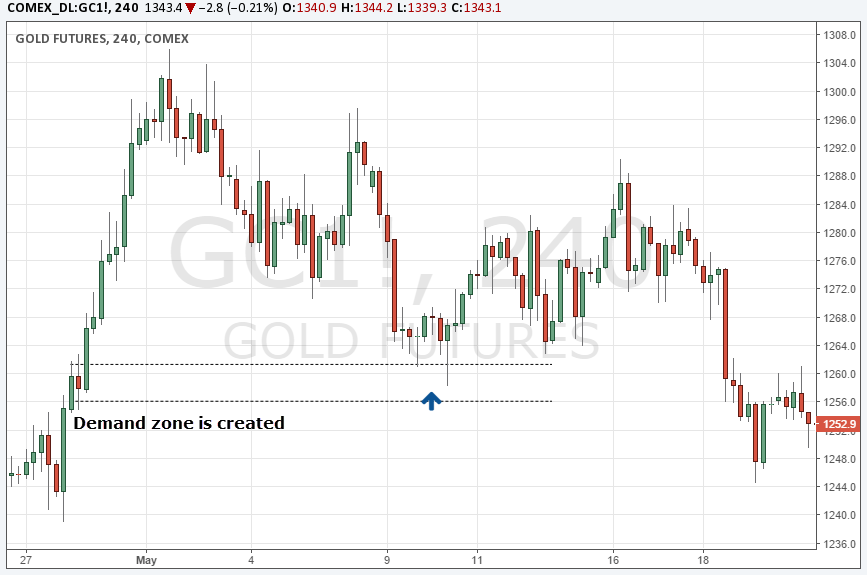
The screenshot below shows a well-defined demand zone on the left side of the chart. You can see that before price started the large rally, it paused for one price candle. This is what technical analysts call a demand zone because in that price area there was a surplus in buying interest that absorbed all selling interest and price had to rally to restore the buying-selling equilibrium; that’s, in a nutshell, how rallies are created and manifest on your charts.
Technical traders can then use this information and when price gets back to the demand zone the next time (we marked that with a blue arrow), there is a good chance that price will again see increased buying power at the demand zone.
In the example below you can see how price dipped into the demand zone a few times but every time got pushed back up again immediately. Supply and demand zones are not only used as additional entry information, but many traders use them to determine potential targets and exits on their trades. Once you start paying attention to supply and demand zones, you will see that they often act as price magnets and price gravitates towards such areas.
Support/Resistance vs Supply/Demand
The question that always comes up in this context is how supply and demand differ from conventional support and resistance. The answer is actually very simple: supply and demand areas are usually the origins of strong trending moves (either up or down), whereas support and resistance levels are confluence areas.
The first level in the chart below shows a classic support and resistance level where price has bounced repeatedly from – marked with an X. The blue zones below the support level show two demand areas. On the left, they were created when price rallied off of those areas very strongly. On the right, when price came back to the zones, the sell-off was stopped and price even turned around completely.
You can see, the concepts of supply/demand and support/resistance can often be found on charts together and a trader who understands both can use this knowledge to analyze price charts effectively.

Zones on top of each other
Just as we saw in the last screenshot above, you’ll often find multiple supply or demand zones on top of each other. Especially during high momentum trends, small consolidations in between trend-waves can often create multiple supply or demand zones.
There are two things a trader should know when it comes to analyzing, understanding and trading stacked supply and demand levels:
1) Price often gravitates to the zone further away. In case of a demand zone (like in the screenshot below), price broke through the first one and then turned around at the lower demand zone. This is a common behavior and it makes sense from a value perspective as traders prefer to buy for a lower, or sell for a higher price.
2) You should avoid trading off of supply and demand zones without confirmation. This means that, in the context of a demand zone, don’t just enter a long trade when price moves into a demand zone. Wait until you can see that price has actually found more buying interest and is moving higher again. This concept of ‘confirmation’ is not only applicable to supply/demand trading but it can be used in many other trading strategies as well.

Price “magnets”
We mentioned it above already and supply/demand zones can also be used for setting target orders and exiting trades because price often gravitates towards such levels. In the screenshot below, we see a supply zone where price sold-off from. Then, price rallied and even though it made a pullback in between, it still made it into the supply zone. Once price reached the supply area, some long positioned traders will likely exit their positions and other traders will enter short, which then leads to a new sell-off from the supply zone.

There is a substantial risk of loss in futures trading. past performance is not indicative of future results.