This article on Moving Average Strategy is the opinion of Optimus Futures

If you’re not familiar with moving averages, here’s a quick demonstration. Let’s imagine that a (hypothetical) commodity ends the day closing at the price of 20.00. The next day, it closes at 22.00. If you average the two prices, you get 21.00 as the 2-day moving average. On the third day, it closes at 25.00. If you average the last three days (20+22+25 divided by 3), you get a simple 3-day moving average of 22.33. It’s an “average” that “moves” as prices change.
So, how can this help you trade futures? A moving average strategy can help you to not only identify the “average” trend, but also “trend strength.” In the first example, the 2-day moving average might have been relatively “slow.” But if the price spiked from 20.00 to 30.00, then the 2-day average would have been 25.00 instead of 21.00. That’s much “faster” than the first example. Get it?
Furthermore, you can use more than one moving average, a slow moving average of, say, 50 days, and a fast moving such as a 5, 10, or 21-day average. This might provide a clearer picture of trend strength on a slower and faster time frame. It might also help you identify trend reversals, as the faster average often reverses before the slower average.
While these uses for moving averages are perfectly acceptable and valid, it can be a great idea to think slightly outside the box and notice other repetitive patterns when combining slow and fast period moving averages.
We will discuss one such approach below highlighting the prominence of the “constriction effect”.
Measuring Trend Strength Using a Moving Average Strategy
When a trend is strong, price tends to move further away from its moving average (though in the same direction). It looks like this:
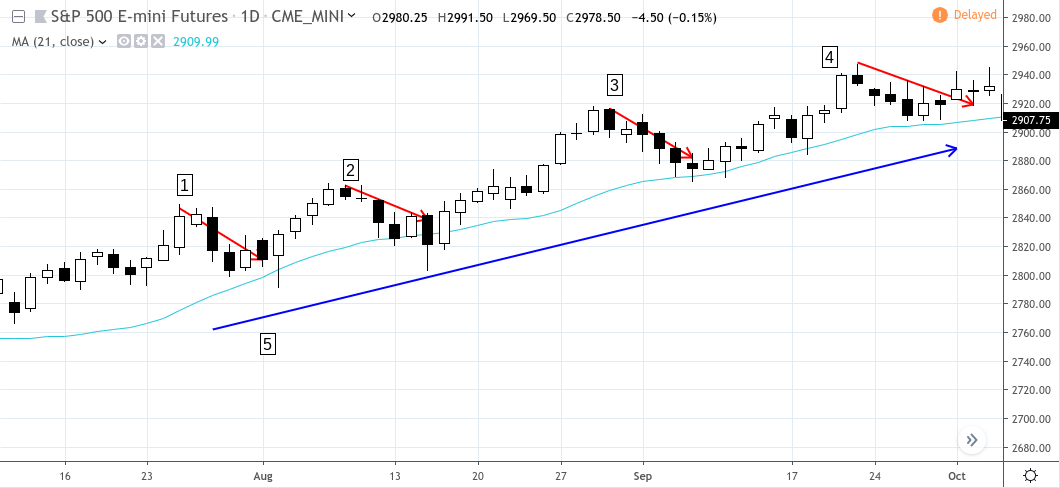
When a trend’s momentum weakens, price tends to revert back toward its moving average line. The items 1 – 4 below illustrate a reversion to the average due to slowing momentum, despite the relatively strong trend as shown at 5.
When price is in a consolidation phase or a trading range–what’s often referred to as moving “sideways” –price can sometimes fluctuate above and below its moving average.
The same can be said if you use two (or more) moving averages–one to measure the short-term trend, and another to measure the longer-term trend.
A strong trend looks like this:

A weakening trend:
And finally, sideways motion (notice the intertwining motion):
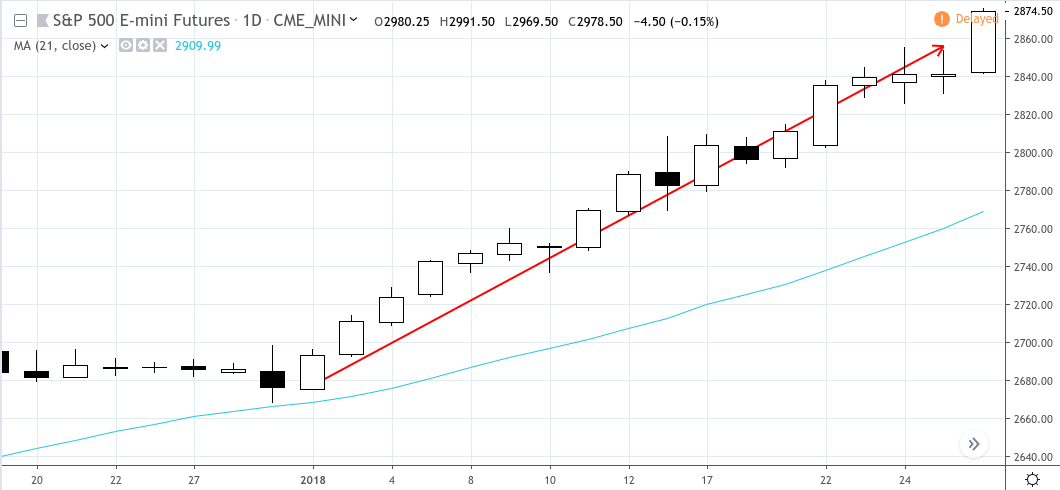
Another way to use moving averages is to plot three averages–short-term, intermediate-term, and long-term–as a proxy for three kinds of traders/investors (short-term traders, intermediate term traders, and long-term position traders or investors).

The daily chart of the Emini S&P 500 (above) shows price action from the beginning of 2017 up to the present. The green moving average shows the 21-day MA, the blue shows the 50-day MA, and the red, the 200-day MA.
If we were to read each moving average as a proxy for investor sentiment, we’d assume that the short- to intermediate-term sentiment fluctuates greatly in terms of bullish and bearish directional bias, while long-term sentiment has remained relatively steady and bullish despite all of the volatility beginning in 2018.
How a Moving Average Strategy Can Help You Identify Actionable Trading Opportunities
Everything we just discussed above can feed into a relatively sound method for making an actionable analysis when trading futures. But you might not want to base your trading entries and exits solely on moving averages alone.
Remember, moving averages “indicate” conditions in the market. They are not surefire “tactical” signals that tell you when to buy or sell, but they can be used as a tactical component within your trading method or system.
When you pair two moving averages–one fast and one slow–you may get a stronger read on a contract’s price momentum. Pay attention to how the two moving averages are moving relative to one another. Are both averages moving strongly in the same direction? If so, that might be a sign of a strong trending movement. Is the faster moving average heading back toward the slower moving average? If so, the shorter-term trend may be reverting to the longer-term trend.
Sometimes, one moving average (usually the slower one, especially if you’re using the 50-MA) may act as “resistance.” In other words, the price might sometimes bounce off it. That’s how some traders use the moving average. And at times, it does work. But it’s not consistent. let alone predictable.
A pair of moving averages can be a powerful tool if you combine it with other technical indicators, chart patterns, or just price action. Let’s put this theory into action and take a look at how moving averages can help you identify actionable trading opportunities.
Scenario 1: Entering a Trending Market

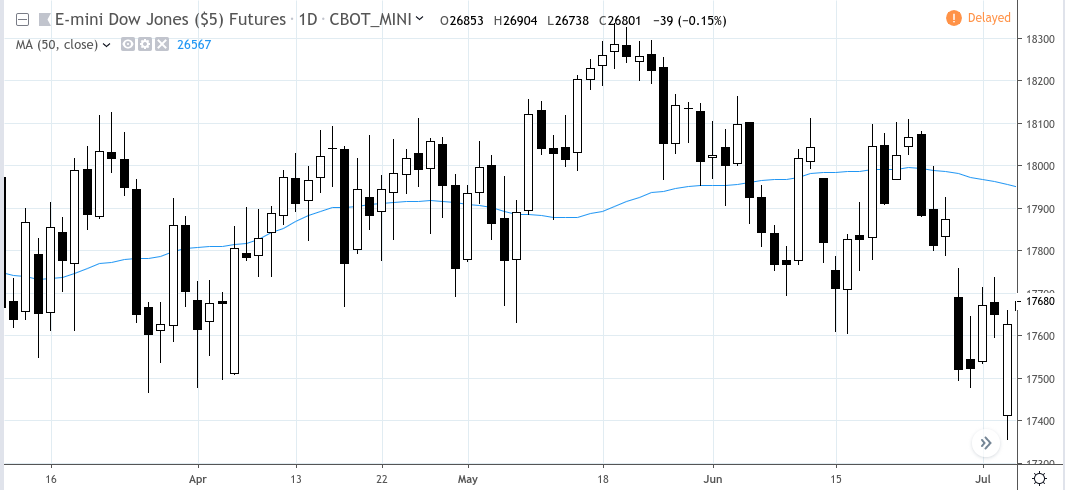
How might you use moving averages to find opportunities to enter a trending market? Take a look at the chart above of the Emini Dow.
The breakouts at [1] and [2] might have presented strong opportunities to go long. Why? The longer-term 50-MA (red) is trending upward. Price dipped below the 21-MA, but–and this is crucial–the low at [B] is still above the previous swing low at [A]. This means the uptrend is still technically intact. An entry at [1] and a stop below [B] might have been the way to place this trade. Price dips below the 21-MA again, but the low at [C] is above the previous swing low at [B]. A breakout from the flat top at [2] with a stop below [C] would have been a reasonable way to place this trade.
Scenario 2: Placing a Counter Trend Trade
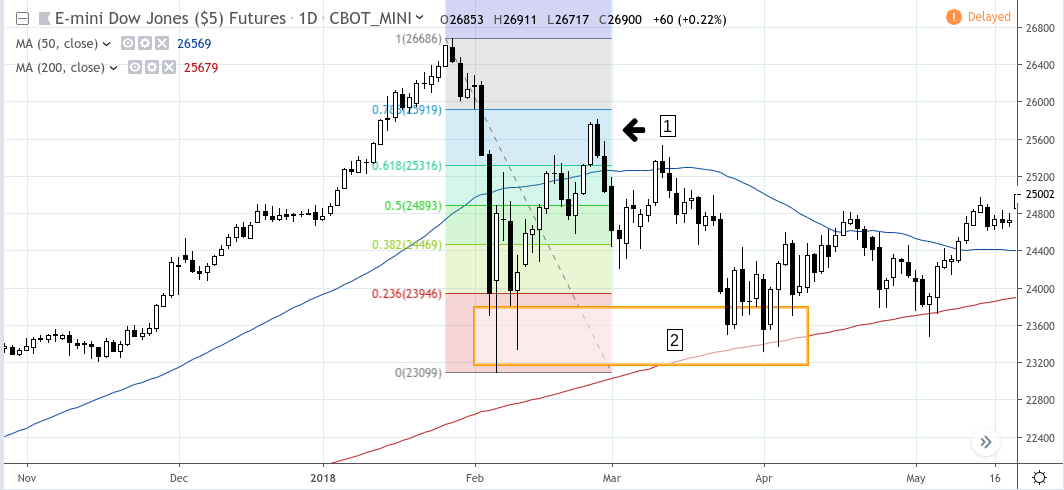
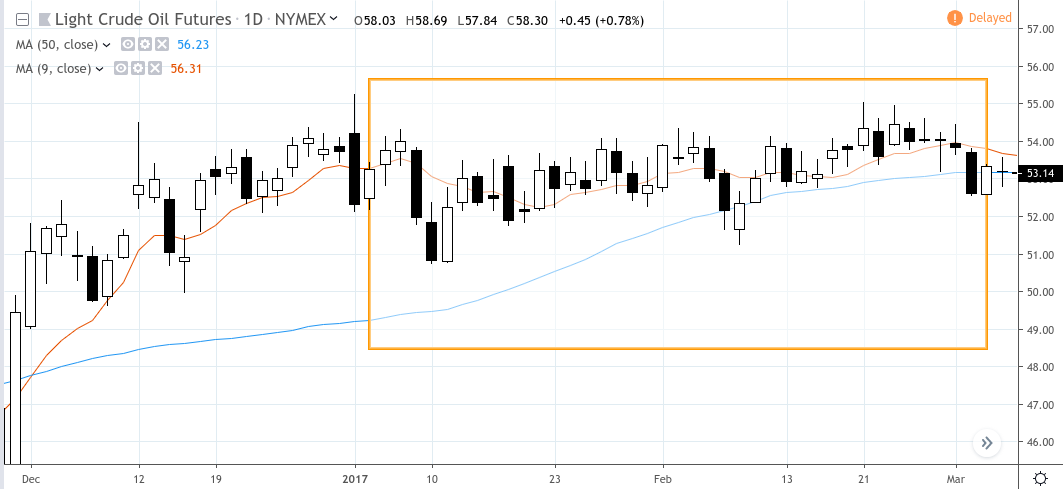
This may have been a riskier trade, but counter trend traders typically take these kinds of risks. On January 26, 2018, the Dow (and other US indices as well) had made a parabolic move skyward. Note the wide distance between price, the 21-MA and 50-MA. With the fundamental and geopolitical backdrop presenting uncertainty, the Dow took a dive in Early February.
Note that there was no fundamental indication to believe that this was anything other than a correction. But when price reversed at [1], it might have made for a reasonably strong short-term counter trend trade. Whether it worked out (which it did) or not, the reasons for a counter trend trade might have been that price reversed near the 78% Fib retracement (bearish bias). And even if the Dow would have reversed eventually, which it did. there’s a likelihood that the range at [2] would have been retested, marking a wide profit target for any trader going short–with the 50-MA providing support (which in this case it did).
Scenario 3: Identifying a Sideways Market

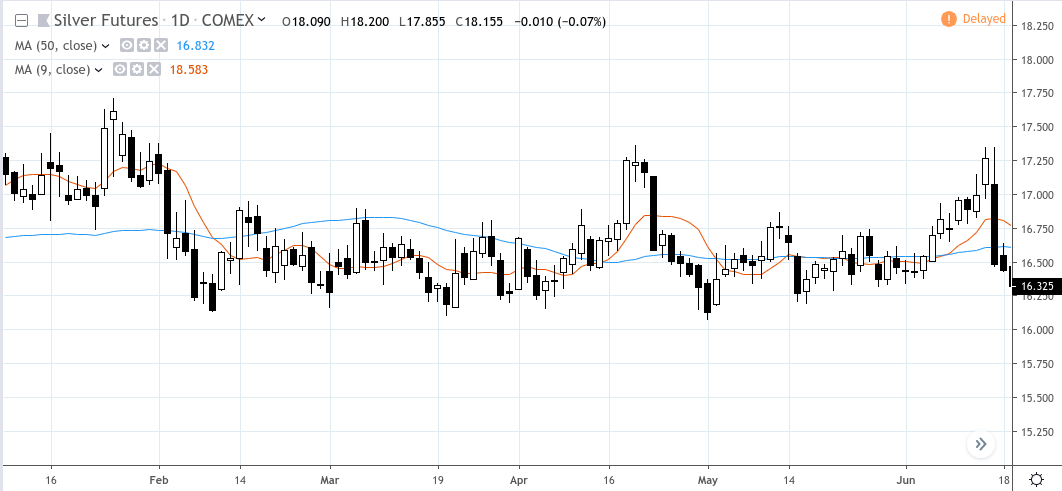
The moving averages would have deceived you into thinking that the uptrend at [1] was resuming unless you looked at a momentum indicator such as the RSI. While the 21-MA was moving higher along with price, the RSI at [2[ gave a reading of declining momentum. Sure enough, the Dow declined, and the 50-MA flattened out at [3], soon to be followed by a weakening in the 21-MA at [4]. The moving averages, in this case, signal a trading range through its flat 50-MA and weakening 21-MA momentum.
There are plenty of more ways to trade a moving average strategy, as there are plenty of different moving averages to use. But hopefully, this shows you a few basic ways to use moving averages to identify futures trading opportunities. And for many traders who prefer to keep things simple, the above examples provide plenty of ideas to work with.
There is a substantial risk of loss in futures trading. Past performance is not indicative of future results.